
NoPetya or EternalPetya has kept the security community pretty busy last week. A malware specimen that uses a combined arms approach and maximizes its capabilities by using different techniques to sabotage business operations. One aspect of the malware that raised my interest was the ability to overwrite the Master Boot Record (MBR) and launch a custom bootloader. This article shows my approach to extract the MBR using digital forensic techniques and then analyze the MBR using Bochs. Before we roll up our sleeves let’s do a quick review on how the MBR is used by today’s computers during the boot process.
The computers that rely on BIOS flash memory instead of the new EFI standard, when they boot, the BIOS code is executed and, among other things, the code performs a series of routines that perform hardware checks i.e., Power-On-Self-Tests (POST). Then, the BIOS attempts to find a bootable device. If the bootable device is a hard drive, the BIOS reads the sector 1, track 0, head 0 and if contains a valid MBR (valid means that the sector ends with bytes 0xAA55) it will load that sector into a fixed memory location. By convention the code will be loaded into the real-mode address 0000:7c00. Then, the instruction pointer register is transferred into that memory location and the CPU will start executing the MBR code. What happens next is dependable on the MBR implementation code i.e., different operating systems have different MBR code Nonetheless, the code needs to fit in the 512-bytes available at disk sector. The MBR follows a standard and its structure contains executable code, the partition table (64-bytes) with the locations of the primary partitions and finally 2-bytes with 0xAA55 signature. This means only 446-bytes are available to implement a MBR. In the Microsoft world, when the MBR code is executed, its role is to find an active partition, read its first sector, which contains the VBR code, load it into memory and transfer execution into it. The VBR is a bootloader program that will find the Windows BootMgr program and executes it All this happens in 16-bits real-mode.
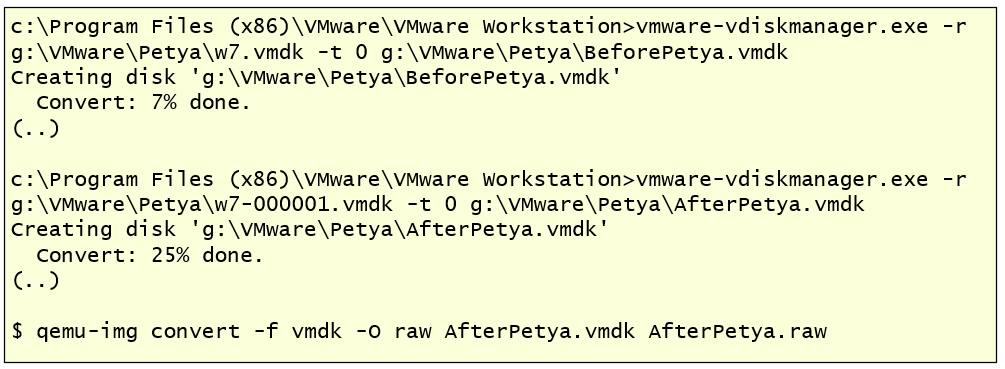
Now, that we have a brief overview about the boot process, how can we extract and analyze the MBR? More specifically the MBR that is used by EternalPetya? Well, we infect a victim machine on a controlled and isolated environment. We know that EternalPetya main component is a DLL and we can launch it and infect a Windows machine by running “rundll32.exe petya.dll, #1 10”. Our setup consisted of 2 Virtual Machines. One running with Windows 7 and another running REMnux. We created a snapshot of the victim machine before the infection. Then executed the malware. Following that, we waited 10 minutes for the infection to complete. The scheduled task created by the malware restarted the operating system and a ransom note appeared. Then, I shutdown the Windows 7 virtual machine and used vmware-vdiskmanager.exe utility to create a single VMDK file from the disk state before and after the infection. Next, I moved the VMDK files to a Linux machine where I used QEMU to convert the VMDK images to RAW format.
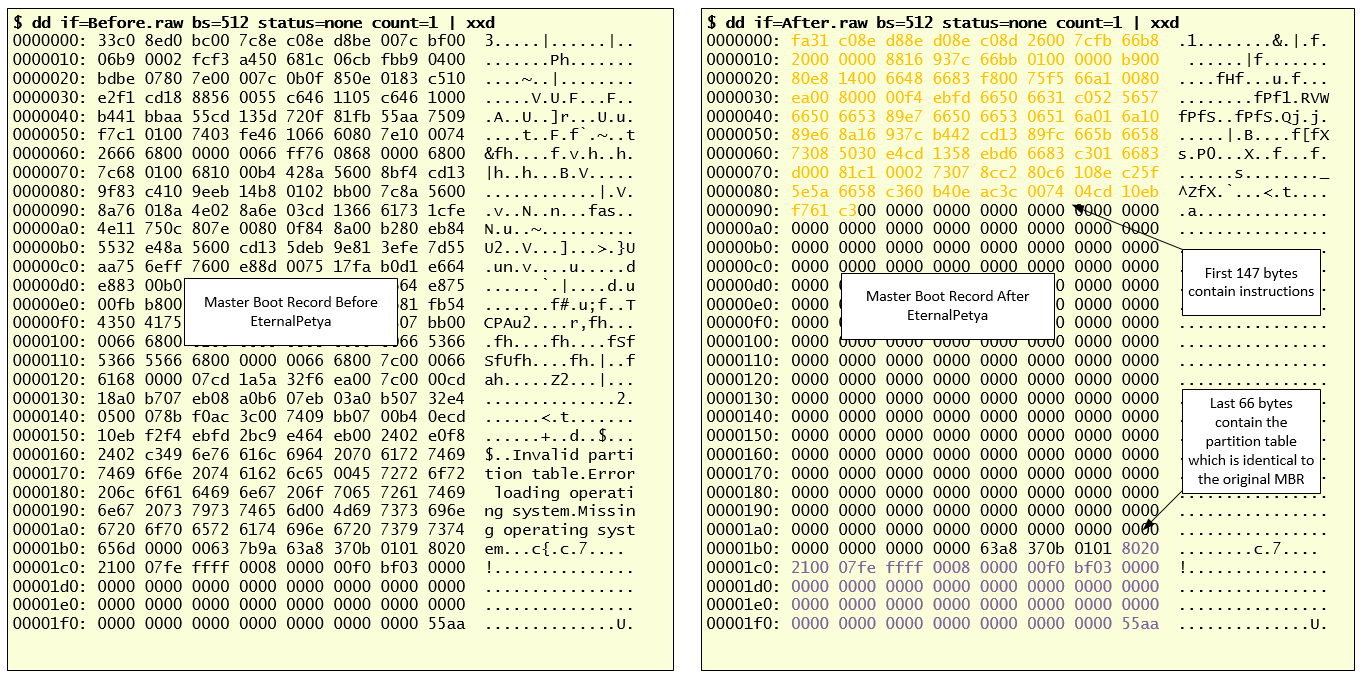
Following that I could start the analysis and look at the MBR differences. The picture below illustrates the difference between the original MBR and the EternalPetya MBR. On the right side you have the EternalPetya MBR, the first 147 bytes (0x00 through 0x92) contain executable code. The last 66 bytes (0x1be through 0x1fd) contain the partition table and are equal to the original MBR.
So, we are interested in the code execution instructions. We can start by extracting the MBR into a binary file and convert it to assembly instructions. This can be done using radare, objdump or ndisasm. Now, this is the hard part of the analysis. Read the assembly instructions and understand what it does. We can look at the instructions and perform static analysis but we can also perform dynamic analysis by running the MBR code, combining both worlds we will have better understanding – or at least we can try.
To perform dynamic analysis of the MBR code we will use Bochs. Bochs is an open source, fully fledged x86 emulator. Originally written by Kevin Lawton in 1994 is still being actively maintained today and last April version 2.6.9 was released. Bochs brings a CLI and GUI debugger and is very useful to debug our MBR code. In addition, Bochs can be integrated with IDA PRO and Radare. You can download Bochs from here. In our case, we want to use Bochs to dynamically debug our MBR code. For that we need a configuration file called Bochsrc which is used to specify different options such as the disk image and also the CHS parameters for the disk. This article from Hex-Rays contains a how-to on how to integrate Bochs with IDA PRO. At the end of the article there is the mbr_Bochs.zip file that you can download. We will use these files to use Bochs standalone or combined with IDA PRO in case you have it. The Bochsrc file that comes with the ZIP file contains options that are deprecated on the newer Bochs version. The picture below shows the Bochsrc options I used. The Bochs user guide documents this file well.

Then you can try your configuration setup and launch Bochs. If you have IDA PRO then you can use this guide starting from step 6 in order to integrate it with IDA PRO. If all is set up, the debugging session will open and stop at the first instruction from its own BIOS code at memory address F000:FFF0. Why this address? You can read this and many other low level things in the outstanding work from Daniel B. Sedory.

Uncomment the last line from the Bochsrc configuration file, to tell Bochs to use the Enhanced Debugger. For further references, you can read the “How to DEBUG System Code using The Bochs Emulator on a Windows™ PC” article. Start Bochs again and the GUI will show up. You can load the stack view by pressing F2. Then set a breakpoint where the MBR code will be loaded by issuing the command “lb 0x7c00” and then the “c” to continue the debugging session.
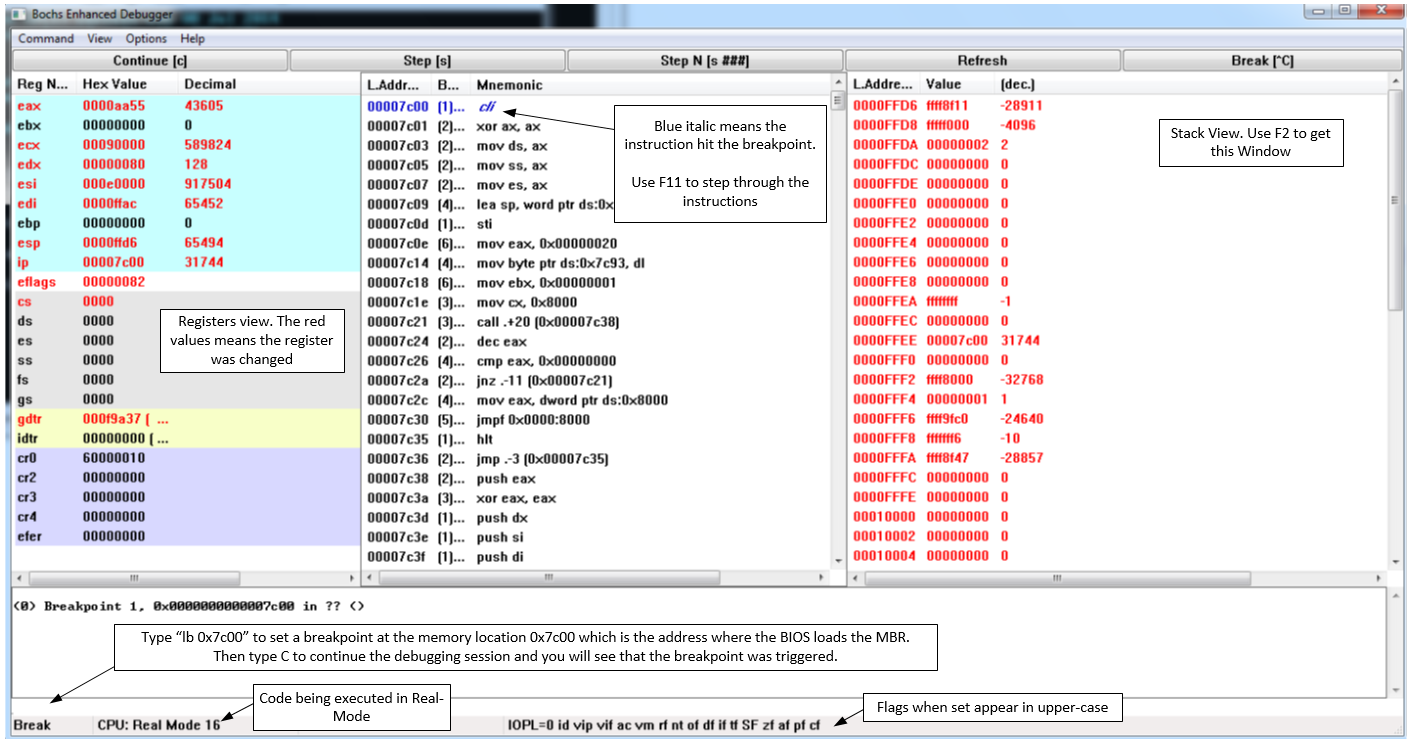
Now we can look at the code, step into the instructions, inspect the registers and stack. After some back and forth with the debugger I created the following listing with my interpretation of some of the instructions.

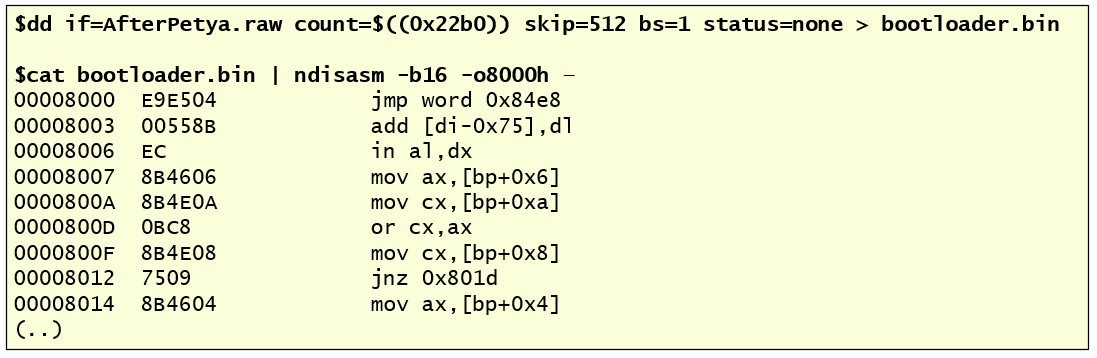
Bottom line, the MBR code will perform a loop that uses BIOS interrupt 0x13 function 0x42 to read data starting at sector 1 of the hard-drive. The loop copies 8880 (0x22af) bytes of data into memory location 0x8000. When the copy is done, the execution is transferred to the address 0x8000 by performing a far jump and the malicious bootloader is executed. The malicious bootloader code has been uploaded by Matthieu Suiche to Virus Total here. You can also extract it from the hard drive by extracting the sector 1 through 18 or better using the commands from the following picture. Then you can perform static and dynamic analysis.
The 16-bits bootloader code is harder to analyze than the MBR code but it is based on the Petya ransomware code from 2016. In this great article, from Hasherezade, she analyzes both Petya and EternalPetya bootloader using IDA PRO. When you use Bochs integrated with IDA PRO disassembler and debugger, the analysis is more accessible due to the powerful combination.
That’s it for today – Entering the world of real-mode execution on x86 is quite interesting. Analyzing code that relies on BIOS services such as software interrupts to perform different operations like reading from disk or writing to screen or, accessing the memory through segments is revealing. What we learned today might be a starting point to start looking at bootkits that are beneath the operating system and subvert the MBR boot sequence.
Have fun!
References:
Windows Internals, Sixth Edition, Part 2 By: Mark E. Russinovich, David A. Solomon, and Alex Ionescu
Various articles written by Daniel B. Sedory : http://starman.vertcomp.com/index.html
http://standa-note.blogspot.ch/2014/11/debugging-early-boot-stages-of-windows.html
