Tag Archives: SOGU

Digital Forensics – PlugX and Artifacts left behind

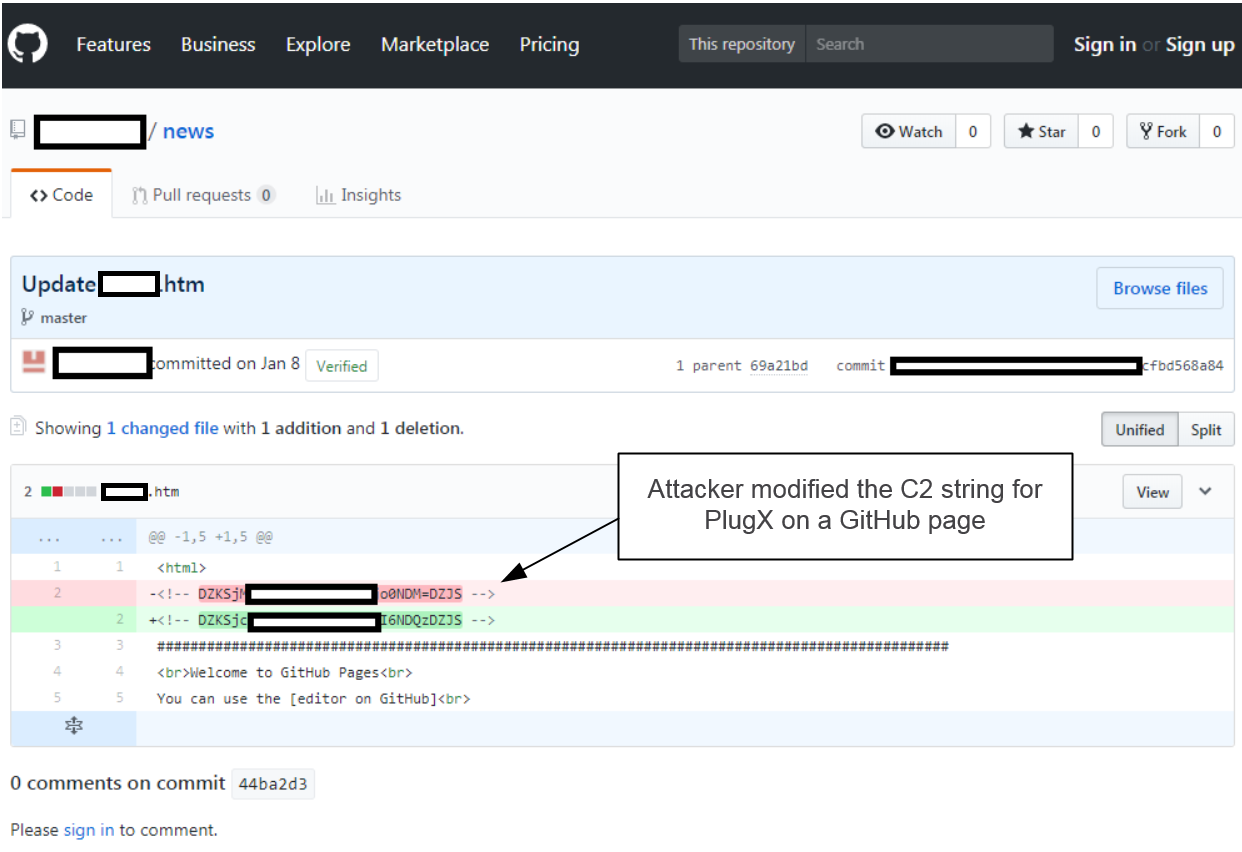
When an attacker conducts an intrusion using A, B or C technique, some of his actions leave artifact X, Y or Z behind. So, based on the scenario from the last article about PlugX, I collected a disk image and memory image from the domain controller. Over the past years I wrote several articles on how to perform acquisition, mounting and processing of such images and analyze them by creating super timelines, look at different artifacts like Event Logs, Prefetch, ShimCache, AMCache, etc., or analyze NTFS metadata or look for artifacts related to interactive sessions. Today, I’m not going to perform analysis but I’m going to list a quick overview about some of the Windows endpoint artifacts that might give us evidence about the actions that were executed in the previous scenario and help us produce a meaningful timeline. In addition, I list some tools that could be used to analyze those artifacts.

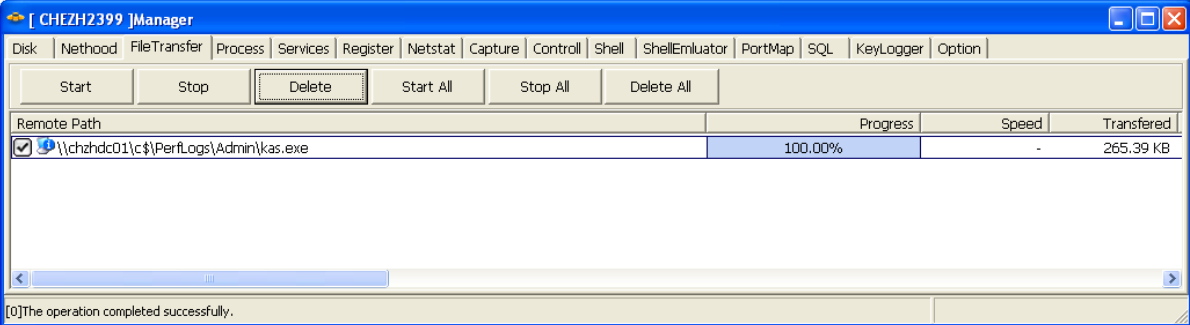
Scenario 1: The attacker placed the filename “kas.exe” on the folder “c:\PerfLogs\Admin”. Which artifacts could record evidence about this action?

  • NTFS MFT
    • Description: The Master File Table (MFT) is a special system file that resides on the root of every NTFS partition. The file is named $MFT and is not accessible via user mode API’s but can been seen when you have raw access to the disk e.g, forensic image. This special file is a hierarchical database and inside you have records that contains a series of attributes about a file, directory and indicates where it resides on the physical disk and if is active or inactive. The size of each MFT record is usually 1024-bytes. Each record contains a set of attributes. Some of the most important attributes in a MFT entry are the $STANDART_INFORMATION, $FILENAME and $DATA. The first two are rather important because among other things they contain the file time stamps. Each MFT entry for a given file or directory will contain 8 timestamps. 4 in the $STANDARD_INFORMATION and another 4 in the $FILENAME. These time stamps are known as MACE.
    • Tools: Parse and analyze it with SleuthKit originally written by Brian CarrierMFT2CSV from Joakim Schicht or PLASO/log2timeline originally created by Kristinn Gudjonsson
  • NTFS INDX Attribute
    • Description: The MFT records for directories contain a special attribute called $I30. This attribute contains information about file names and directories that are stored inside a directory. This special attribute is also known as $INDX and consists of three attributes, the $INDEX_ROOT, $INDEX_ALLOCATION and $BITMAP. So, What? Well, this attribute stores information in a B-tree data structure that keeps data sorted so the operating system can perform fast searches in order to determine if a file is present. In addition, this attribute grows to keep track of file names inside the directory. However, when you delete a file from a directory the B-tree re-balances itself but the tree node with metadata about the deleted file remains in a form of slack space until it gets reused. This means we can view the $I30 attribute contents and we might find evidence of files that once existed in a directory but are no longer there.
      Tools: o Parse it and analyze it with INDXParse from William Ballenthin or MFT2CSV from Joakim Schicht.
  • NTFS $LogFile
    • Description: NTFS has been developed over years with many features in mind, one being data recovery. One of the features used by NTFS to perform data recovery is the Journaling. The NTFS Journal is kept inside NTFS Metadata in a file called $LOGFILE. This file is stored in the MFT entry number 2 and every time there is a change in the NTFS Metadata, there is a transaction recorded in the $LOGFILE. These transactions are recorded to be possible to redo or undo file system operations. After the transaction has been logged then the file system can perform the change. When the change is done, another transaction is logged in the form of a commit. The $LOGFILE allows the file system to recover from metadata inconsistencies such as transactions that don’t have a commit. The size of the $LOGFILE can be consulted and changed using chkdsk /l and per default is 65536 KB. Why would $LOGFILE be important for our investigation? Because the $LOGFILE keeps record of all operations that occurred in the NTFS volume such as file creation, deletion, renaming, copy, etc. Therefore, we might find relevant evidence in there.
    • Tools: Parse it and analyze it with LogFileParser from Joakim Schicht
  • NTFS $UsnJrnl
    • Description: The change journal contains a wealth of information that shouldn’t be overlooked. Another interesting aspect of the change journal is that allocates space and deallocates as it grows and records are not overwritten unlike the $LogFile. This means we can find old journal records in unallocated space on a NTFS volume. How to obtain those? Luckily, the tool USN Record Carver written by PoorBillionaire can carve journal records from binary data and thus recover these records
    • Tools: Parse and analyze it with UsnJrnl2Csv from Joakim Schicht or from unallocated space with USN Record Carver from PoorBillionaire.

Scenario 2: Which account did the attacker used to log into the system when he placed “kas.exe” on the file system?

  • Windows Event Logs
    • Description: The Windows Event logs record activities about the operating system and its applications. What is logged depends on the audit features that are turned thus impacting the information that one can obtain. From a forensic perspective the Event Logs capture a wealth of information. The main three Windows Event Logs are Application, System, and Security and on Windows Vista and beyond they are saved on %System32%\winevt\Logs in a binary format. For example the Event id’s 4624, 4625 might give us answers.
    • Tools: Parse it and Analyze it with PLASO/Log2timeline, LibEvtx-utils from Joakim Schicht , python-evtx from William Ballenthin or Event Log Explorer. You likely get better results if in your environment if you have consistent and enhanced audit policy settings defined that track both success and failures. In case the attacker  deletes the Windows Event Logs, there is the possibility to recover Windows Event Log records from the pagefile.sys or from unallocated space, from Volume Shadow copies or even the system Memory. You could use EVTXtract from Willi Ballenthin to attempt to recover Event logs from raw data.

Scenario 3: Attacker executed the “kas.exe” binary. Which artifacts might record this evidence?

  • Windows Prefetch / Superfetch
    • Description: To improve customer experience, Microsoft introduced a memory management technology called Prefetch. This functionality was introduced into Windows XP and Win-dows 2003 Server. This mechanism analyses the applications that are most frequently used and preloads them in advance in order speed the operating system booting and application launching. On Windows Vista, Microsoft enhanced the algorithm and introduced SuperFetch which is an improved version of Prefetch. The Prefetch files are stored in %SYSTEMROOT%\Prefetch directory and have a .pf extension. The Superfetch files have a .db extension. Prefetch files keep track of programs that have been executed in the system even if the original file is no longer present. In addition Prefetch files can tell you when the program was executed, how many times and from which path.
    • Tools: PLASO/log2timeline, Windows-Prefetch-Parser from Adam Witt, Prefetch Parser from Eric Zimmerman. For Superfetch you could use SuperFetch tools.
  • ShimCache either from Registry or from Kernel Memory
    • Description: Microsoft introduced the ShimCache in Windows 95 and it remains today a mechanism to ensure backward compatibility of older binaries into new versions of Microsoft op-erating systems. When new Microsoft operating systems are released some old and legacy application might break. To fix this Microsoft has the ShimCache which acts as a proxy layer between the old application and the new operating system. A good overview about what is the ShimCache is available on the Microsoft Blog on an article written by Tim Newton “Demystifying Shims – or – Using the App Compat Toolkit to make your old stuff work with your new stuff“. The interesting part is that from a forensics perspective the ShimCache is valuable because the cache tracks metadata for binary that was executed and stores it in the ShimCache.
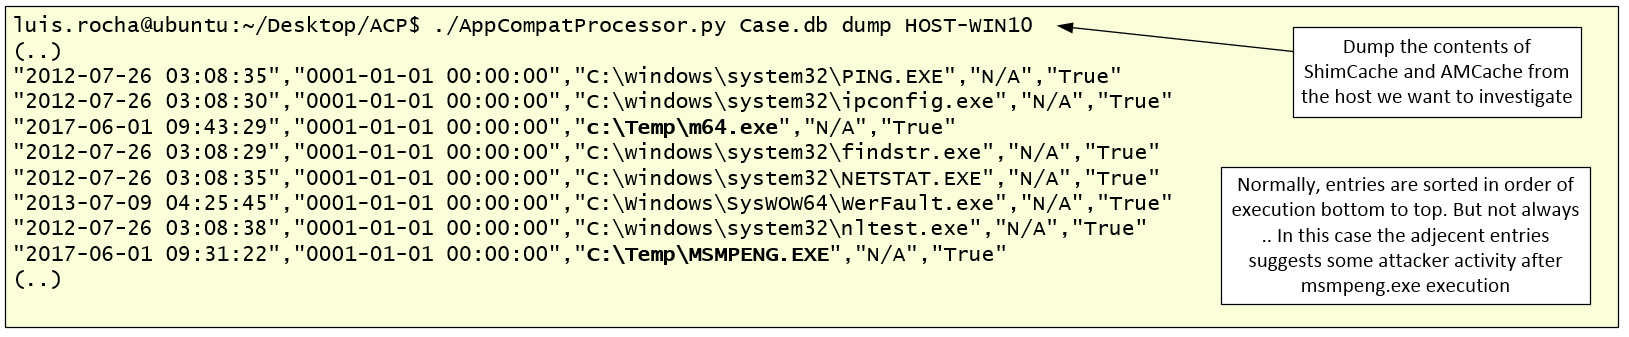
    • Tools: From Kernel memory, you can parse it and analyze it with Volatility ShimCache and ShimCacheMem plugin. From the Registry you can use ShimCacheParser https://github.com/mandiant/ShimCacheParser. You can also use RegRipper from Harlan Carvey or AppCompatCacheParser from Eric Zimmerman. In addition, to analyze ShimCache artifacts at scale you can use AppCompatProcessor from Mattias Bevilacqua,
  • AMCache
    • Description: On Windows 8, Amcache.hve replaced the RecentFileCache.bcf file, a registry file used in Windows 7 as part of the Application Experience and Compatibility feature to ensure compatibility of existing software between different versions of Windows. Similar to its predecessor, Amcache.hve is a small registry hive that stores a wealth of information about recently run applications and programs, including full path, file timestamps, and file SHA1 hash value. Amcache.hve is commonly found at the following location: C:\Windows\AppCompat\Programs\Amcache.hve. The Amcache.hve file is standard within the Windows 8 operating system, but has been found to exist on Windows 7 systems as well.
    • Tools: To read the amcache HIVE you could use RegRipper or Willi Ballenthin stand-alone script or Eric Zimmerman AmcacheParser. To analyze AMCache artifacts at scale you can use AppCompatProcessor from Mattias Bevilacqua,
  • Windows Event Logs. 
    • The Windows Event logs – for example id 4688 – could track binary execution if you have the proper audit settings or you use Sysmon.

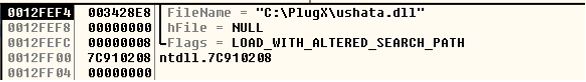
Scenario 4: The execution of “kas.exe” dropped three files on disk that used DLL Search Order Hijacking to achieve persistence and install the malicious payload. Which artifacts might help identifying this technique?

Identifying evidence of DLL Search Order hijacking is not easy if no other leads are available. Likely you need a combination of artifacts. The following artifacts / tools might help.

  • NTFS MFT, INDX, $LogFile, $UsnJrnl.
  • Prefetch / SuperFetch.
  • ShimCache either from Registry or from Kernel Memory.
  • AMCache.
  • Windows Event Logs could track process execution and give you leads if you have the proper audit settings or you use Sysmon
  • Volatility to perform memory analysis.
  • RegRipper – One thing you could try, among many others that this powerful tool allows,is to identify different persistence mechanism that could have resulted as part of the DLL Search Order Hijacking technique.
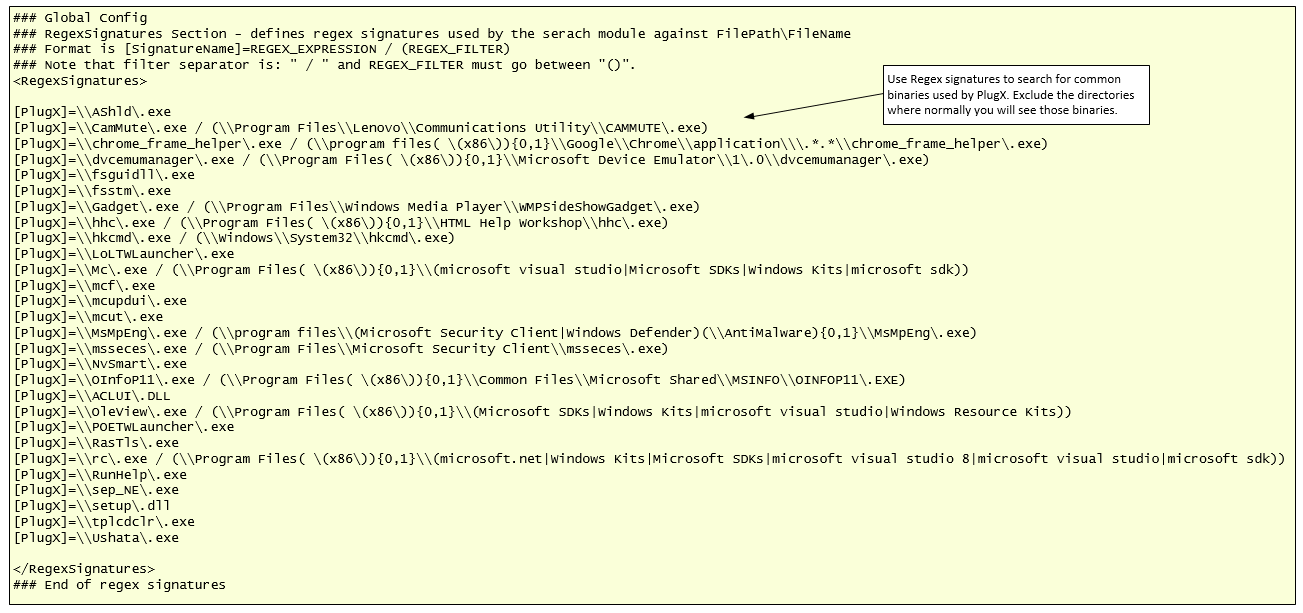
  • AppCompatProcessor to analyze ShimCache and AMCache at scale combined with with PlugX signatures.

Scenario 5: The PlugX dropped files have the NTFS timestamps manipulated i.e., It copies the timestamps obtained from the operating system filename ntdll.dll to set the timestamps on the dropped files. What artifacts could be used to detect this?

The time modification will cause a discrepancy between the NTFS $STANDART_INFORMATION and $FILENAME timestamps. You could combine the NTFS artifacts with the execution artifacts to spot such anomalies.  Other technique you could use is with AppCompat Processor which has the Time Stomp functionality that will search for appcompat entries outside of the Windows,  System and SysWOW64 folders with last modification dates matching a list of known operating system files.

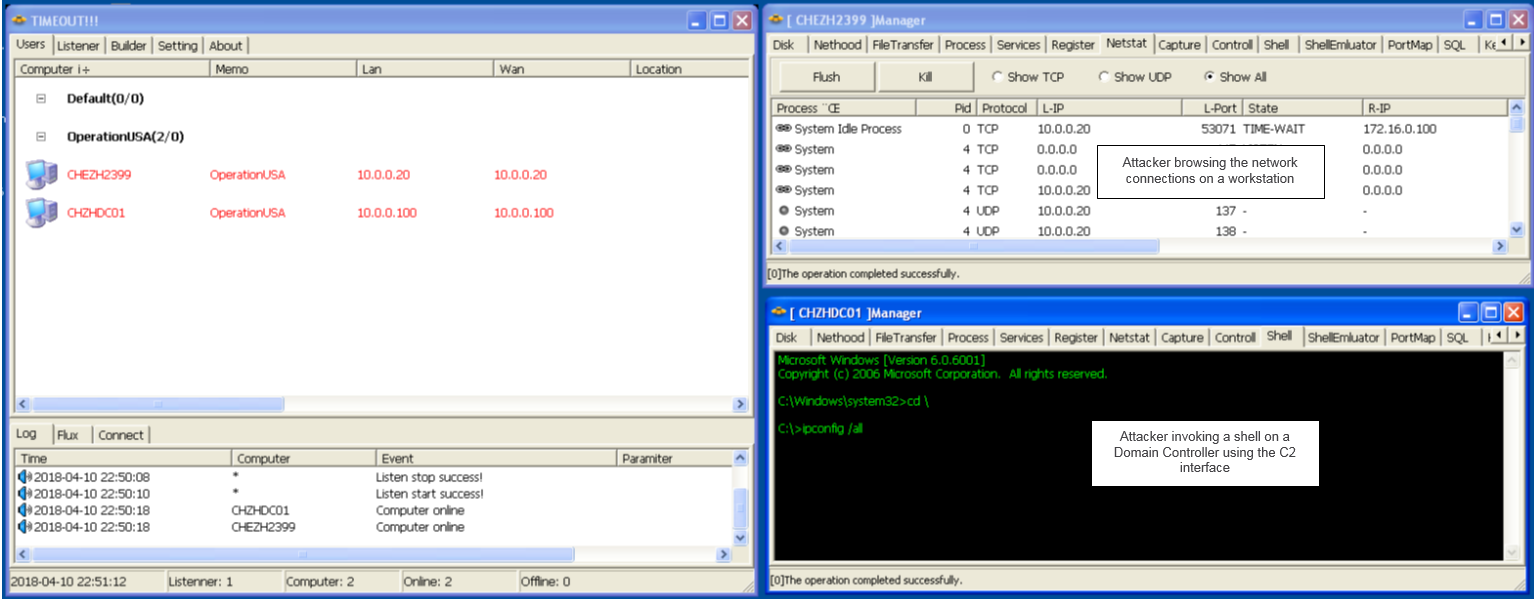
Scenario 6: Attacker used the PlugX controller to Invoke a command shell and execute Windows built-in commands. Are there any artifacts left behind that could help understand commands executed?

  • ShimCache either from Registry or from Kernel Memory.
  • Memory analysis with Volatility and look for Process creation, Console History, cmdscan or consoles plugin.
  • The Windows Event logs could track process execution if you have the proper audit settings or you use Sysmon.

Scenario 7: Attacker established a persistence mechanism either using a Service or Registry Key. 

  • Producing a timeline of the Registry would help identify the last modification dates of the registry keys. You could use RegRipper from Harlan Carvey or RECmd from Eric Zimmerman. The Windows Event logs would also help in case the there was a service created on the operating system. For example Event ID 7009, 7030, 7035, 7036, 7040, 7023 or 7045 could help. In addition, to list the services and its properties you could perform memory analysis with Volatility or use RegRipper.

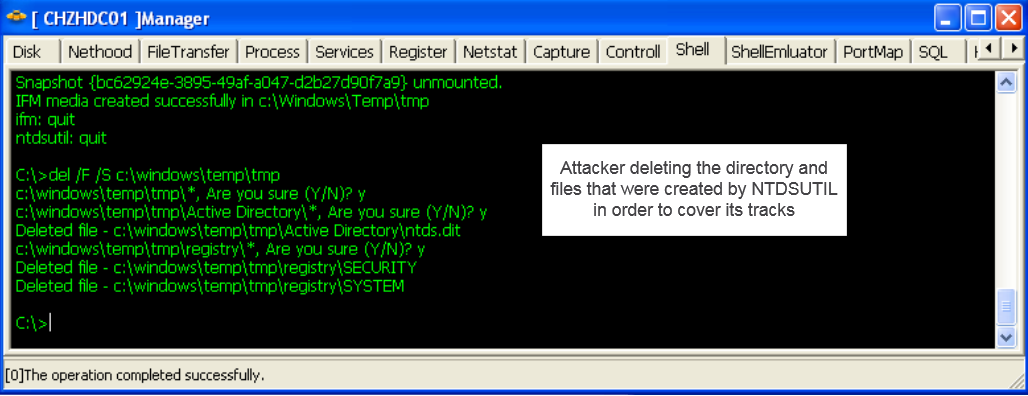
Scenario 8: The attacker accessed the Active Directory database using the “ntdsutil.exe” command. What could be used to detect this activity?

  • As we saw previously, command execution could be identified using ShimCache either from Registry or from Kernel Memory. Because “ntdsutil.exe” would be executed on a Server system, Prefetch won’t help here because its not enabled on Server systems. One of the most usefull artifacts would be the Windows Event logs but you need to have the right settings so it could track binary execution and the interactions with the Active Directory. One thing that might help in case the memory image has been acquired not long after the attacker activity is to perform memory analysis and creating a timeline of the artifacts with Volatility might help identifying the process creation and its parent(s). In addition, you might get interesting leads just by running strings (little and  big endian) on the pagefile.sys. Other than that, the execution of “ntdsutil.exe” the way it was executed on the scenario, leaves behind artifacts on the NTFS metadata.

That’s it for today. With this article I presented a quick listing on some artifacts and tools that can help you perform forensic analysis on a system and help you answer your investigative questions. Many other tools and artifacts would be available depending on the attacker activities, for example if the attacker logged into a system interactively, but the ones listed might give you a starting point and might help you understand what happened and when. One thing that would greatly complement the findings of a system forensic analysis the network data such as the ones that comes from Firewall, Router, IDS or Proxy logs or any other kind of networking logs you might have. Specially if attacker is using a C2 and is clearing evidence such as the threat group that used a file named “a.bat” to clean several artifacts as illustrated on the “Paranoid PlugX” article written by Tom Lancaster and Esmid Idrizovic from Unit 42.

Happy hunting and If you have dealt with a security incident where PlugX was used, please leave your comments about the tools or techniques you used to detect it.

Tagged , , , , , , , , , ,

Malware Analysis – PlugX – Part 2

Following my previous article on PlugX, I would like to continue the analysis but now use the PlugX controller to mimic some of the steps that might be executed by an attacker. As you know the traditional steps of an attack lifecycle follow, normally, a predictable sequence of events i.e., Reconnaissance, initial compromise, establish foothold, escalate privileges, internal reconnaissance, move laterally, maintain persistence, complete mission. For sake of brevity I will skip most of the steps and will focus on the lateral movement.I will use the PlugX controller and C2 functionality to simulate an attacker that established a foothold inside an environment and obtained admin access to a workstation. Following that, the attacker moved laterally to a Windows Domain Controller. I will use the PlugX controller to accomplish this scenario and observe how an attacker would operate within a compromised environment.

As we saw previously, the PlugX controller interface allows an operator to build payloads, set campaigns and define the preferred method for the compromised hosts to check-in and communicate with the controller. In the PlugX controller, English version from Q3 2013, an operator can build the payload using two techniques. One is using the “DNS Online” technique which allows the operator to define the C2 address e.g, an URL or IP address, that will be used by the payload to speak with the C2. The other method, is the “Web Online”, which allows the operator to tell the payload from where it should fetch the C2 address. This method allows the operator to have more control over the campaign. The following diagram illustrates how the “Web Online” technique works.

Why do I say this technique would allow an attacker to have more control? Consider the case that an organization was compromised by a threat actor that use this PlugX technique. In case the C2 is discovered, the impacted organization could block the IP or URL on the existing boundary security controls as a normal reaction to the concerns of having an attacker inside the network. However, the attacker could just change the C2 string and point it to a different system. In case the organization was not able to scope the incident and understand the TTP’s (Tools, Tactics and Procedures) then the attacker would still maintain persistence in the environment. This is an example that when conducting incident response, among other things, you need to have visibility into the tools and techniques the attacker is using so you could properly scope the incident and perform effective and efficient containment and eradication steps. As an example of this technique, below is a print screen from a GitHub page that has been used by an unknown threat actor to leverage this method.

So, how to leverage this technique on the PlugX builder? The picture below shows how the operator could create a payload that uses the “Web Online” technique. The C2 address would be fetched from a specified site e.g. a Pastebin address, which on its turn would redirect the payload to the real C2 address. The string “DZKSAFAAHHHHHHOCCGFHJGMGEGFGCHOCDGPGNGDZJS” in this case is used to decode to the real C2 address which is “www.builder.com”. On the “PlugX: some uncovered points” article, Fabien Perigaud writes about how to decode this string. Palo Alto Unit42 gives another example of this technique on the “Paranoid PlugX” article. The article “Winnti Abuses GitHub for C&C Communications” from Cedric Pernet ilustrates an APT group leveraging this technique using GitHub.

For sake of simplicity, in this article, I’m going to use the DNS Online technique using “www.builder.com” as C2 address. Next, on the “First” tab I specify the campaing ID and the password used by the payload to connect to the C2.

Next, on the Install tab I specify the persistence settings, in this case I’m telling the payload to install a service and I can specify different settings including where to deploy the binaries, the service name and service description. In addition, I can specify that if the Service persistence mechanism fails due to some reason the payload should install the persistence mechanism using the Registry and I can specify which HIVE should be used.

Then, In the inject tab I specify which process will be injected with the malicious payload. In this case I choose “svchost.exe”. This will make PlugX start a new instance of “svchost.exe” and then inject the malicious code into svchost.exe process address space using process hollowing technique.

Other than that, the operator could define a schedule and determine which time of the week the payload should communicate with the C2. Also the operator could define the Screen Recording capability that will take screenshots at a specific frequency and will save them encrypted in a specific folder.

Last settings on the “option” tab allow the operator to enable the keylogger functionality and specify if the payload should hide it self and also delete itself after execution.

Finally, after all the settings defined, the operator can create/download the payload in different formats. An executable, binary form (Shellcode), or an array in C that can then be plugged in another delivery mechanism e.g, PowerShell or MsBuild. After deploying and installing the payload on a system, that system will check-in into the PlugX controller and an operator can call the “Manager” to perform the different actions. In this example I show how an attacker, after having compromised a system, uses the C2 interface to:

  • Browse the network

  • Access remote systems via UNC path

  • Upload and execute a file e.g., upload PlugX binary

  • Invoke a command shell and perform remote commands e.g., execute PlugX binary on a remote system

Previous pictures illustrate actions that the attacker could perform to move laterally and, for example, at some point in time, access a domain controller via UNC path, upload the PlugX payload to a directory of its choice and execute it. In this case the pictures show that the PlugX payload was dropped into c:\PerfLogs\Admin folder and then was executed using WMI. Below example shows the view from the attacker with two C2 sessions. One for one workstation and another for a domain controller.

Having access to a domain controller is likely one of the goals of the attacker so he can obtain all the information he needs about an organization from the Active Directory database.

To access the Active Directory database, the attacker could, for example, run the “ntdsutil.exe” command to create a copy of the “NTDS.dit” file using Volume Shadow Copy technique. Then, the attacker can access the database and download it to a system under his control using the PlugX controller interface. The picture below illustrates an attacker obtained the relevant data that was produced using the “ntdsutil.exe” command.

Finally, the attacker might delete the artifacts that were left behind on the file system as consequence of running “ntdsutil.exe”.

So, in summary, we briefly looked at the different techniques a PlugX payload could be configured to speak with a Command and Controller. We built, deploy and install a payload. Compromised a system and obtain a perspective from PlugX operator. We move laterally to a domain controller and installed the PlugX payload and then used a command shell to obtain the Active Directory database. Of course, as you noted, the scenario was accomplished with an old version of the PlugX controller. Newer versions likely have many new features and capabilities. For example, the print screen below is from a PlugX builder from 2014 (MD5: 534d28ad55831c04f4a7a8ace6dd76c3) which can create different payloads that perform DLL Search order hijacking using Lenovo’s RGB LCD Display Utility for ThinkPad (tplcdclr.exe) or Steve Gibson’s Domain Name System Benchmarking Utility (sep_NE.exe). The article from Kaspersky “PlugX malware: A good hacker is an apologetic hacker” outlines a summary about it.

That’s it! With this article we set the table for the next article focusing on artifacts that might helps us uncover the hidden traits that were left behind by the attacker actions performed during this scenario. Stay tuned and have fun!


Tagged , , , ,

Malware Analysis – PlugX

[The PlugX malware family has always intrigued me. I was curious to look at one variant. Going over the Internet and the research articles and blogs about it I came across the research made by Fabien Perigaud. From here I got an old PlugX builder. Then I set a lab that allowed me to get insight about how an attacker would operate a PlugX campaign. In this post, l will cover a brief overview about the PlugX builder, analyze and debug the malware installation and do a quick look at the C2 traffic. ~LR]

PlugX is commonly used by different threat groups on targeted attacks. PlugX is also refered as KORPLUG, SOGU, DestroyRAT and is a modular backdoor that is designed to rely on the execution of signed and legitimated executables to load malicious code. PlugX, normally has three main components, a DLL, an encrypted binary file and a legitimate and signed executable that is used to load the malware using a technique known as DLL search order hijacking. But let’s start with a quick overview about the builder.

The patched builder, MD5 6aad032a084de893b0e8184c17f0376a, is an English version, from Q3 2013,  of the featured-rich and modular command & control interface for PlugX that allows an operator to:

  • Build payloads, set campaigns and define the preferred method for the compromised hosts to check-in and communicate with the controller.
  • Proxy connections and build a tiered C2 communication model.
  • Define persistence mechanisms and its attributes.
  • Set the process(s) to be injected with the payload.
  • Define a schedule for the C2 call backs.
  • Enable keylogging and screen capture.
  • Manage compromises systems per campaign.

Then for each compromised system, the operator has extensive capabilities to interact with the systems over the controller that includes the following modules:

  • Disk module allows the operator to write, read, upload, download and execute files.
  • Networking browser module allows the operator to browse network connections and connect to another system via SMB.
  • Process module to enumerate, kill and list loaded modules per process.
  • Services module allows the operator to enumerate, start, stop and changing booting properties
  • Registry module allows the operator to browse the registry and create, delete or modify keys.
  • Netstat module allows the operator to enumerate TCP and UDP network connections and the associated processes
  • Capture module allows the operator to perform screen captures
  • Control plugin allows the operator to view or remote control the compromised system in a similar way like VNC.
  • Shell module allows the operator to get a command line shell on the compromised system.
  • PortMap module allows the operator to establish port forwarding rules.
  • SQL module allows the operator to connect to SQL servers and execute SQL statements.
  • Option module allows the operator to shut down, reboot, lock, log-off or send message boxes.
  • Keylogger module captures keystrokes per process including window titles.

The picture below shows the Plug-X C2 interface.

So, with this we used the builder functionality to define the different settings specifying C2 comms password, campaign, mutex, IP addresses, installation properties, injected binaries, schedule for call-back, etc. Then we build our payload. The PlugX binary produced by this version of the builder (LZ 2013-8-18) is a self-extracting RAR archive that contains three files. This is sometimes referred in the literature as the PlugX trinity payload. Executing the self-extracting RAR archive will drop the three files to the directory chosen during the process. In this case “%AUTO%/RasTls”. The files are: A legitimate signed executable from Kaspersky AV solution named “avp.exe”, MD5 e26d04cecd6c7c71cfbb3f335875bc31, which is susceptible to DLL search order hijacking . The file “avp.exe” when executed will load the second file: “ushata.dll”, MD5 728fe666b673c781f5a018490a7a412a, which in this case is a DLL crafted by the PlugX builder which on is turn will load the third file. The third file: “ushata.DLL.818”, MD5 “21078990300b4cdb6149dbd95dff146f” contains obfuscated and packed shellcode.

So, let’s look at the mechanics of what happens when the self-extracting archive is executed. The three files are extracted to a temporary directory and “avp.exe” is executed. The “avp.exe” when executed will load “ushata.dll” from the running directory due to the DLL search order hijacking using Kernel32.LoadLibrary API.

Then “ushata.dll” DLL entry point is executed. The DLL entry point contains code that verifies if the system date is equal or higher than 20130808. If yes it will get a handle to “ushata.DLL.818”, reads its contents into memory and changes the memory address segment permissions to RWX using Kernel32.VirtualProtect API. Finally, returns to the first instruction of the loaded file (shellcode). The file “ushata.DLL.818” contains obfuscated shellcode. The picture below shows the beginning of the obfuscated shellcode.

The shellcode unpacks itself using a custom algorithm. This shellcode contains position independent code. Figure below shows the unpacked shellcode.

The shellcode starts by locating the kernel32.dll address by accessing the Thread Information Block (TIB) that contains a pointer to the Process Environment Block (PEB) structure. Figure below shows a snippet of the shellcode that contains the different sequence of assembly instructions for the code to find the Kernel32.dll.

It then reads kernel32.dll export table to locate the desired Windows API’s by comparing them with stacked strings. Then, the shellcode decompresses a DLL (offset 0x784) MD5 333e2767c8e575fbbb1c47147b9f9643, into memory using the LZNT1 algorithm by leveraging ntdll.dll.RtlDecompressBuffer API. The DLL contains the PE header replaced with the “XV” value. Restoring the PE header signature allows us to recover the malicious DLL.

Next, the payload will start performing different actions to achieve persistence. On Windows 7 and beyond, PlugX creates a folder “%ProgramData%\RasTl” where “RasTl” matches the installation settings defined in the builder. Then, it changes the folder attributes to “SYSTEM|HIDDEN” using the SetFileAttributesW API. Next, copies its three components into the folder and sets all files with the “SYSTEM|HIDDEN” attribute.

The payload also modifies the timestamps of the created directory and files with the timestamps obtained from ntdll.dll using the SetFileTime API.

Then it creates the service “RasTl” where the ImagePath points to “%ProgramData%\RasTl\avp.exe”

If the malware fails to start the just installed service, it will delete it and then it will create a persistence mechanism in the registry by setting the registry value “C:\ProgramData\RasTls\avp.exe” to the key “HKLM\SOFTWARE\Classes\SOFTWARE\Microsoft\Windows\CurrentVersion\Run\RasTls” using the RegSetValueExW API.

If the builder options had the Keylogger functionality enabled, then it may create a file with a random name such as “%ProgramData%\RasTl\rjowfhxnzmdknsixtx” that stores the key strokes. If the payload has been built with Screen capture functionality, it may create the folder “%ProgramData%\RasTl \RasTl\Screen” to store JPG images in the format <datetime>.jpg that are taken at the frequency specified during the build process. The payload may also create the file “%ProgramData%\DEBUG.LOG” that contains debugging information about its execution (also interesting that during execution the malware outputs debug messages about what is happening using the OutputDebugString API. This messages could be viewed with DebugView from SysInternals). The malicious code completes its mission by starting a new instance of “svchost.exe” and then injects the malicious code into svchost.exe process address space using process hollowing technique. The pictures below shows the first step of the process hollowing technique where the payload creates a new “svchost.exe” instance in SUSPENDED state.

and then uses WriteProcessMemory API to inject the malicious payload

Then the main thread, which is still in suspended state, is changed in order to point to the entry point of the new image base using the SetThreadContext API. Finally, the ResumeThread API is invoked and the malicious code starts executing. The malware also has the capabilities to bypass User Account Control (UAC) if needed. From this moment onward, the control is passed over “svchost.exe” and Plug-X starts doing its thing. In this case we have the builder so we know the settings which were defined during building process. However, we would like to understand how could we extract the configuration settings. During Black Hat 2014, Takahiro Haruyama and Hiroshi Suzuki gave a presentation titled “I know You Want Me – Unplugging PlugX” where the authors go to great length analyzing a variety of PlugX samples, its evolution and categorizing them into threat groups. But better is that the Takahiro released a set of PlugX parsers for the different types of PlugX samples i.e, Type I, Type II and Type III. How can we use this parser? The one we are dealing in this article is considered a PlugX type II. To dump the configuration, we need to use Immunity Debugger and use the Python API. We need to place the “plugx_dumper.py” file into the “PyCommands” folder inside Immunity Debugger installation path. Then attached the debugger to the infected process e.g, “svchost.exe” and run the plugin. The plugin will dump the configuration settings and will also extract the decompressed DLL

We can see that this parser is able to find the injected shellcode, decode its configuration and all the settings an attacker would set on the builder and also dump the injected DLL which contains the core functionality of the malware.

In terms of networking, as observed in the PlugX controller, the malware can be configured to speak with a controller using several network protocols. In this case we configured it to speak using HTTP on port 80. The network traffic contains a 16-byte header followed by a payload. The header is encoded with a custom routine and the payload is encoded and compressed with LZNT1. Far from a comprehensive analysis we launched a Shell prompt from the controller, typed command “ipconfig” and observed the network traffic. In parallel, we attached a debugger to “svchost.exe” and set breakpoints: on Ws2_32.dll!WSASend and Ws2_32.dll!WSARecv to capture the packets ; on ntdll.dll!RtlCompressBuffer and ntdll.dll!RtlDecompressBuffer to view the data before and after compression. ; On custom encoding routine to view the data before and after. The figure below shows a disassemble listing of the custom encoding routine.

So, from a debugger view, with the right breakpoints we could start to observe what is happening. In the picture below, on the left-hand side it shows the packet before encoding and compression. It contains a 16-byte header, where the first 4-bytes are the key for the custom encoding routine. The next 4-bytes are the flags which contain the commands/plugins being used. Then the next 4-bytes is the size. After the header there is the payload which in this case contains is output of the ipconfig.exe command. On the right-hand side, we have the packet after encoding and compressing. It contains the 16-byte header encoded following by the payload encoded and compressed.

Then, the malware uses WSASend API to send the traffic.

Capturing the traffic, we can observe the same data.

On the controller side, when the packet arrives, the header will be decoded and then the payload will be decoded and decompressed. Finally, the output is showed to the operator.

Now that we started to understand how C2 traffic is handled, we can capture it and decode it.  Kyle Creyts has created a PlugX decoder that supports PCAP’s. The decoder supports decryption of PlugX Type I.But Fabien Perigaud reversed the Type II algorithm and implemented it in python. If we combine Kyle’s work with the work from Takahiro Haruyama and Fabien Perigaud we could create a PCAP parser to extract PlugX Type II and Type III. Below illustrates a proof-of-concept for this exercise against 1 packet. We captured the traffic and then used a small python script to decrypt a packet. No dependencies on Windows because it uses the herrcore’s standalone LZNT1 implementation that is based on the one from the ChopShop protocol analysis and decoder framework by MITRE.

That’s it for today! We build a lab with a PlugX controller, got a view on its capabilities. Then we looked at the malware installation and debugged it in order to find and interpret some of its mechanics such as DLL search order hijacking, obfuscated shellcode, persistence mechanism and process hollowing. Then, we used a readily available parser to dump its configuration from memory. Finally, we briefly looked the way the malware communicates with the C2 and created a small script to decode the traffic. Now, with such environment ready, in a controlled and isolated lab, we can further simulate different tools and techniques and observe how an attacker would operate compromised systems. Then we can learn, practice at our own pace and look behind the scenes to better understand attack methods and ideally find and implement countermeasures.

References:
Analysis of a PlugX malware variant used for targeted attacks by CRCL.lu
Operation Cloud Hopper by PWC
PlugX Payload Extraction by Kevin O’Reilly
Other than the authors and articles cited troughout the article, a fantastic compilation about PlugX articles and papers since 2011 is available here.

Credits: Thanks to Michael Bailey who showed me new techniques on how to deal with shellcode which I will likely cover on a post soon.

Tagged , , , , ,

Threat Hunting in the Enterprise with AppCompatProcessor

Last April, at the SANS Threat Hunting and IR Summit, among other things, there was a new tool and technique released by Matias Bevilacqua. Matias’s presentation was titled “ShimCache and AmCache enterprise-wide hunting, evolving beyond grep” and he released the tool AppCompatProcessor. Matias also wrote a blog post “Evolving Analytics for Execution Trace Data” with more details.

In this article, I want to go over a quick exercise on how to use this tool and expand the existing signatures. First, let me write that, in case you have a security incident and you are doing enterprise incident response or you are performing threat hunting as part of your security operations duties, this is a fantastic tool that you should become familiar with and have on your toolkit. Why? Because it allows the security teams to digest, parse and analyze, at scale, two forensic artifacts that are very useful. The forensic artifacts are part of the Windows Application Experience and Compatibility features and are known as ShimCache and the AMCache.

To give you more context, the ShimCache can be obtained from the registry and from it we can obtain information about all executable binaries that have been executed in the system since it was rebooted. Furthermore, it tracks its size and the last modified date. In addition, the ShimCache tracks executables that have not been executed but were browsed for example through explorer.exe. This makes a valuable source of evidence for example to track executables that were on the system but weren’t executed – consider an attacker that used a directory on a system to move around his toolkit. The AMCache is stored on a file and from it we can retrieve information for every executable that run on the system such as the PATH, last modification time and created, SHA1 and PE properties. You can read more about those 2 artifacts in the article I wrote last year.

So, I won’t go over on how to acquire this data at scale – feel free to share you technique in the comments – but, AppCompatProcessor digests data that has been acquired by ShimCacheParser.py, Redline and MIR but also consumes raw ShimCache and AMCache registry hives. I will go directly to the features.At the time of this writing the tool version is 0.8 and one of the features I would like to focus today is the search module. This module allows us to search for known bad using regex expressions. The search module was coded with performance in mind, which means the regex searches are quite fast. By default, the tool includes more than 70 regex signatures for all kinds of interesting things an analyst will look for when perform threat hunting. Signatures include searching for dual usage tools like psexec , looking for binaries in places where they shouldn’t normally be, commonly named credential dumpers, etc. The great thing is that you can easily include your own signatures. Just add a regex line with your signature!

For this exercise, I want to use the search module to search for binaries that are commonly used by the PlugX backdoor family and friends. This backdoor is commonly used by different threat groups on targeted attacks. PlugX is also refered as KORPLUG, SOGU, DestroyRAT and is a modular backdoor that is designed to rely on the execution of signed and legitimated executables to load malicious code. PlugX, normally has three main components, a DLL, an encrypted binary file and a legitimated executable that is used to load the malware using a technique known as DLL search order. I won’t go discuss the details about PlugX in this article but you can read the White Paper “PlugX – Payload Extraction” done by Kevin O’Reilly from Context, the presentation about Plugx at Black Hat ASIA in 2014 given by Takahiro Haruyama and Hiroshi Suzuki, the analysis done by the Computer Incident Response Center Luxembourg and the Ahnlab threat report. With this and other reports you could start compiling information about different PlugX payloads. However, Adam Blaszczyk from Hexacorn, already did that job and wrote an article where he outlines different PlugX payloads seen in the wild.

Ok, with this information, we start creating the PlugX regex signatures. Essentially we will be looking for the signed and legitimate executables but in places where they won’t normaly be. The syntax to create a new regex signature is simple and you can add your own signatures to the existing AppCompatSearch.txt file or just create a new file called AppCompatSearch-PlugX.txt which will be consumed automatically by the tool. The figure below shows the different signatures that I produced. . At the time of this writing, this is still work in progress but is a starting point.

Next step, launch AppCompatProcessor against our data set using the newly created signatures. The following picture shows how the output of the search module looks like. In this particular case the search produced 25 hits and a nicely presented summary of the hits is displayed on a histogram. The raw dumps of the hits are saved on the file called Output.txt.  As an analyst or investigator, you would look at the results and verify which ones would be worth to further investigate and which ones are false positives. For this exercise, there was a hit that triggered on the file “c:\Temp\MsMpEng.exe”. This file is part of the Windows Defender suite but could be used by PlugX as part of DLL search order hijack technique. Basically, the attacker will craft a malicious DLL named MpSvc.dll and will place that in the same directory as the MsMpEng.exe file and execute MsMpEng.exe. The DLL would need to be crafted in a special way but that is what PlugX specializes in. This will load the attacker code.

Following these findings, we would want to look at the system that triggered the signature and view all the entries. The picture below shows this step where we use the dump module. The output shows all the ShimCache entries for this particular system. The entries are normally sorted in order of execution from bottom to top, and in this case, adjacent to the “c:\Temp\MsMpEng.exe” file there are several windows built-in commands that were executed and a file named “c:\Temp\m64.exe”. This is what Matias calls a strong temporal execution correlation. This is indicative that an attacker obtained access to the system, executed several windows built-in commands and and executed a file called “m64.exe” which likely is Mimikatz or a cousin. 

Following those leads, you might want to obtain those binaries from the system and perform malware analysis in order to extract indicators of compromise such as the C&C address, look at other artifacts such Windows Event Logs, UsnJournal, memory, etc.. and have additional leads. In addition, you might want to further use AppCompatProcessor to search for the “m64.exe” file and also use the tstack module, to search across all the data set for binaries that match the date of those two binaries. With these findings, among other things, you would need to scope the incident by understanding which systems the attacker accessed, find new investigation leads and pivot on the findings. AppCompatProcessor is a tool that helps doing that. This kind of finding would definitely trigger your incident response processes and procedures.

That’s it, hopefully, AppCompatProcessor will reduce the entry barrier for your security operations center or incident response teams to start performing threat hunting in your environment and produce actionable results. If you find this useful, contribute with your threat hunting signatures in AppCompatProcessor GitHub repo and Happy Hunting!


Tagged , , , , , ,