 Let’s continue our digital forensics journey and start where we left off. To contextualize the reader, the posts below are the previous articles on this series:
- Evidence Acquisition and Mounting
- Evidence Processing with Super Timeline
- NTFS Metadata and Timeline
- Super Timeline and Event Logs part I
- Super Timeline and Event Logs part II
- Prefetch Artifacts
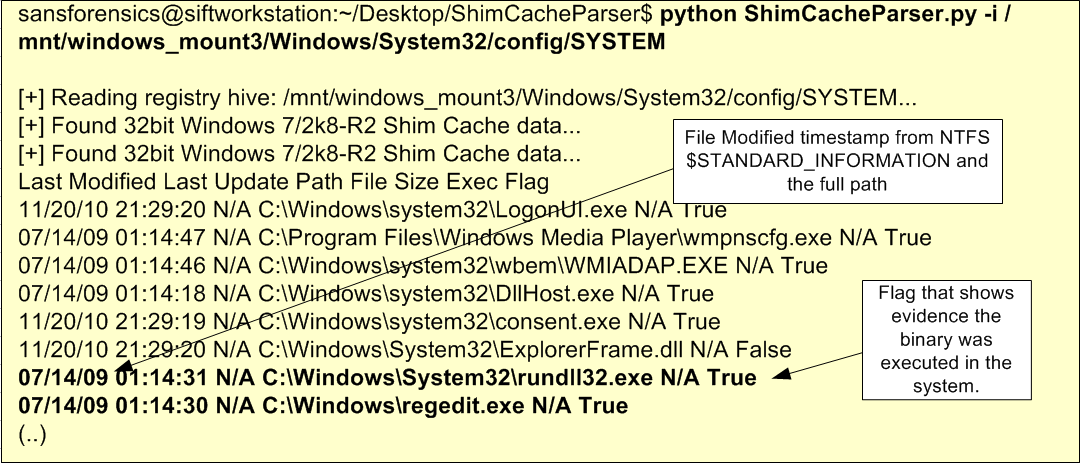
- ShimCache Artifacts
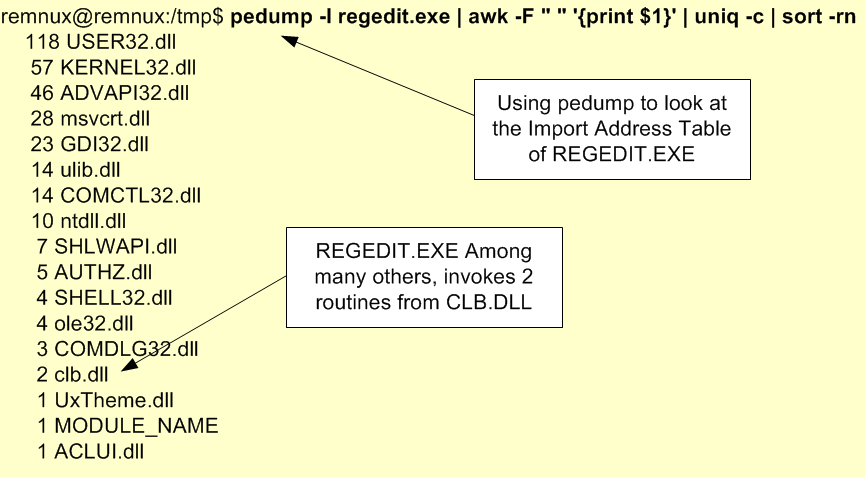
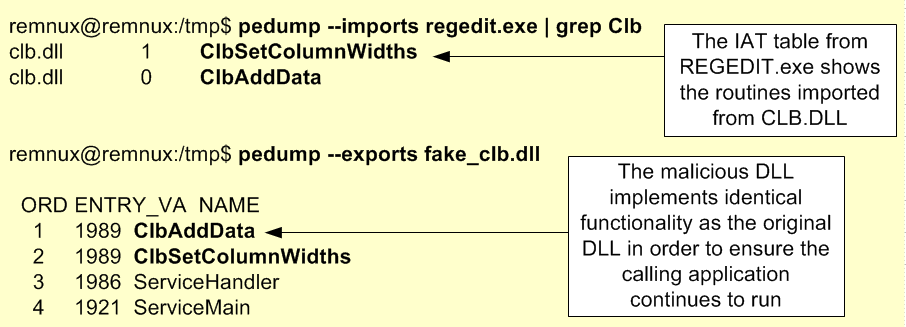
- DLL Search Order
We now want to find traces of the DLL – CLB.DLL – that was invoked from the wrong directory and understand what happened e.g., was it deleted by the attacker? To support our quest we need to look deep into the NTFS file system.
One of the first articles I wrote on this series was a brief explanation about the NTFS metadata and the Master File Table – which might give you more background on the topic below. To summarize, the Master File Table (MFT) is a special system file that resides on the root of every NTFS partition. The file is named $MFT and is not accessible via user mode API’s but can been seen when you have raw access to the disk e.g, forensic image. This special file is a hierarchical database and inside you have records that contains a series of attributes about a file, directory and indicates where it resides on the physical disk and if is active or inactive. The size of each MFT record is usually 1024-bytes. In the last post we reviewed three relevant attributes of the MFT records ; the $STANDART_INFORMATION, the $FILENAME and $DATA. The first two are rather important because among other things they contain the file time stamps..
In this article we will look at the MFT records for directories (further down we will also look at the NTFS Journaling).
Why? Because the MFT records for directories contain a special attribute called $I30. This attribute contains information about file names and directories that are stored inside a particular directory. This special attribute is also known as $INDX and consists of three attributes, the $INDEX_ROOT, $INDEX_ALLOCATION and $BITMAP.
So, What? Well, this attribute stores information in a B-tree data structure in order to keep data sorted so the operating system can perform fast searches in order to determine if a file is present. In addition, this attribute grows in size in order to keep track of file names inside the directory. However, when you delete a file from a directory the B-tree re-balances itself but the tree node with metadata about the deleted file remains in a form of slack space until it gets reused. This means we can view the $I30 attribute contents and we might find evidence of files that once existed in a particular directory but are no longer there. The contents of the $I30 attribute contain the file name, the MACE time stamps from the $FILE_NAME, the file size and the MFT entry number for the file and parent directory.
How can we see the $I30 contents for a particular directory? We will cover two different methods. First method, is a manual approach using the tools available in The Sleuth Kit to extract it and then we use the INDXParser.py tool from Willi Ballenthin to parse its contents. The second method is faster and we will use the tool LogFileParser from Joakim Schicht.
Let’s cover the first approach using the SIFT workstation. You can view the $INDX contents in four steps:
- Use fls against a disk image or ls against a mounted imaged to get the MFT entry number for the directory we want to analyze. In this case the Windows directory.
- Use istat to get the identifier number for the $I30 attribute. You can also verify if it contains resident data.
- Use icat to dump the $INDX contents into a file.
- Use INDXParser.py to parse its contents and view file names, size and MACE timestamps.
The image below illustrates the first step where we use fls to read the EWF disk image and get the its contents.
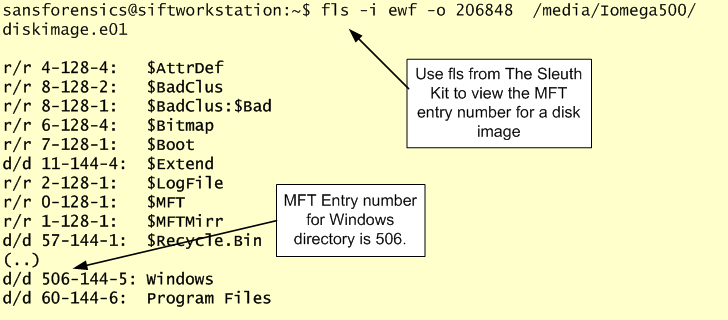
The image below illustrates the second step where we can view the MFT record properties for the entry number 506.

In our case the Windows folder is stored in the MFT entry number 506 and the identifier we are looking is the 160 which points to the contents of the $INDX. The identifier 144 points to the root node. With this information, we can dump the data using icat. Then we execute INDXParser.py with the suffix –d in order to search in slack space.
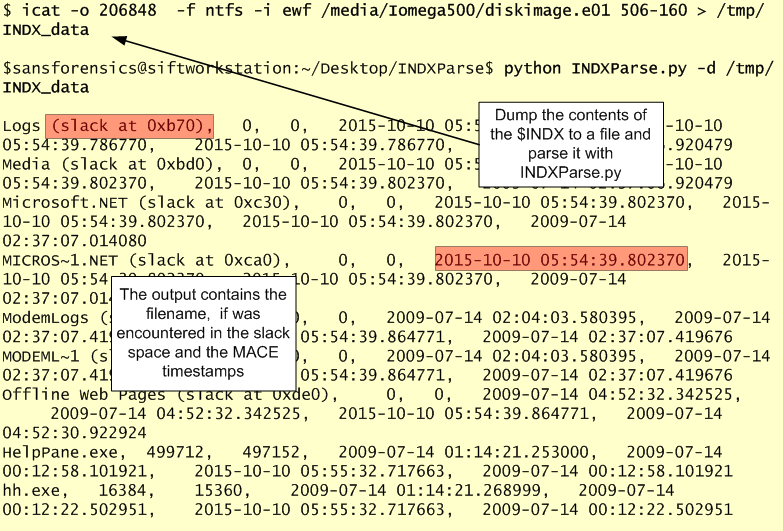
Unfortunately, in this case we could not find traces of our DLL. This might occur due to the B-tree nodes of the $I30 data structure being reused. This happens due to the normal file system activity. Normally, there is good chance to find evidence about deleted files in the $I30 attributes using the first method. But if for some reason we couldn’t find any traces we could try the second method.
The second method relies on LogFileParser.exe to parse a different NTFS metadata file which is called $LOGFILE. Before we try this method let’s review what is the $LOGFILE. NTFS has been developed over years with many features in mind, one being data recovery. One of the features used by NTFS to perform data recovery is the Journaling. The NTFS Journal is kept inside NTFS Metadata in a file called $LOGFILE. This file is stored in the MFT entry number 2 and every time there is a change in the NTFS Metadata, there is a transaction recorded in the $LOGFILE. These transactions are recorded in order to be possible to redo or undo file system operations. After the transaction has been logged then the file system can perform the change. When the change is done, another transaction is logged in the form of a commit. The $LOGFILE allows the file system to recover from metadata inconsistencies such as transactions that don’t have a commit. The size of the $LOGFILE can be consulted and changed using chkdsk /l and per default is 65536 KB.
Why would $LOGFILE be important for our investigation? Because the $LOGFILE keeps record of all operations that occurred in the NTFS volume such as file creation, deletion, renaming, copy, etc. Therefore, we might find traces of our file here.
Now, let’s use our second method. We had to give you context about the $LOGFILE because the LogFileParser.exe is able to parse $INDX attributes based on information available in the transaction logs. We will now use the powerful, granular tool developed by Joakim Schicht called LogFileParser. For those who are not familiar with Joakim Schicht, he is a brilliant engineer and researcher who has enormously contributed to the Forensics community with many powerful tools. This tool -LogFileParser – is a fantastic tool for low level analysis of the NTFS. It runs on Windows and we can point it to our mounted evidence in the SIFT workstation.
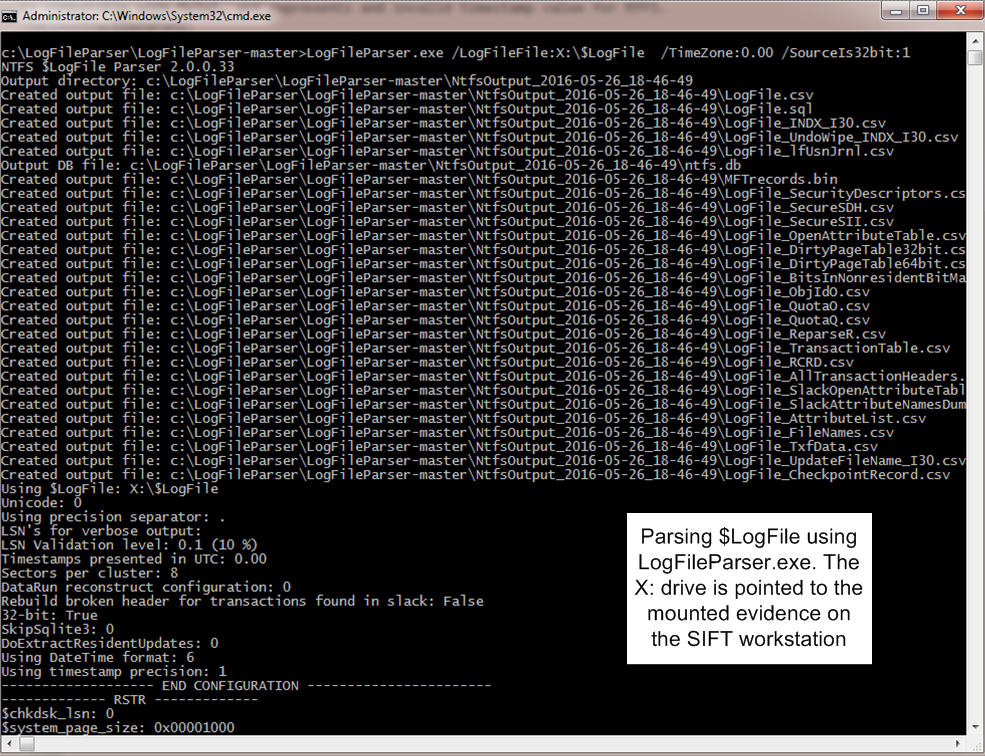
The output is quite verbose and you can read about its capabilities and meanings in the README file. The parsing won’t take long and then we can analyze the output by just grepping for our file.
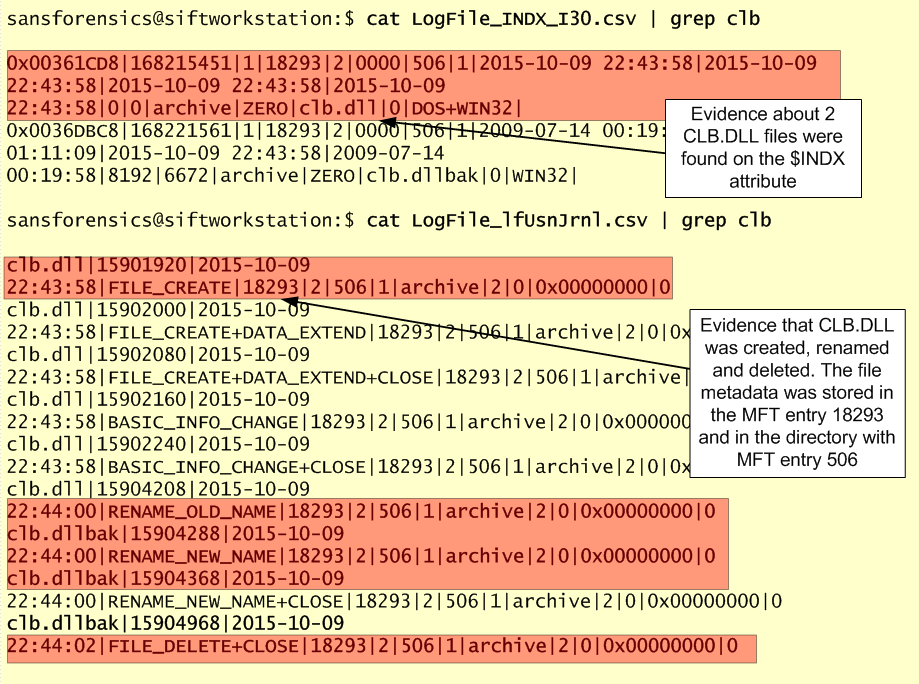
When searching for our missing and malicious DLL across the LogFileParser output files we found evidence of it on INDX attributes and transaction logs.
Based on the transaction operations recorded on the $LOGFILE we can see evidence that the CLB.DLL file was created on the WINDOWS folder at 22:43:58 and seconds after the file was renamed to CLB.DLLBAK and finally deleted. This time stamp matches the Prefetch and Shimcache artifacts.. We can see it was created on the Windows folder because of the parent MFT entry number 506 which matches the Windows MFT entry we were analyzing in the beginning. Quite fascinating facts that we observed by looking at the $INDX attribute and the $LOGFILE from NTFS metadata.
That’s it! In this article we reviewed NTFS metadata and different tools and techniques that we can leverage to view artifacts about evidence of deleted files . The INDX attribute which is used to store metadata about files inside directories and the $LOGFILE which keeps record of all operations that occurred in the NTFS volume. Both this artifacts can give us a great amount of information and detail about attacker activity and should be part of your forensic toolkit. We now have another piece of our investigation that we can put into our SuperTimeline.
If you want to read more about $INDX attributes there is a great article written in 2011 by Chad Tilbury here. In addition William Ballenthin & Jeff Hamm wrote a four part blog post series with great detail about the $INDX attributes.
References:
Windows Internals, Sixth Edition, Part 2 By: Mark E. Russinovich, David A. Solomon, and Alex Ionescu
File System Forensic Analysis By: Brian Carrier
https://github.com/jschicht/LogFileParser