Category Archives: Digital Forensics and Incident Response

FireEye Endpoint Security (HX) – Supplementary Tools

Today I am going to write a few notes about tools that should be part of your toolkit in case you use FireEye Endpoint Security product a.k.a. as HX. If you don’t use FireEye HX, this post likely has no interest for you.

I tend to use HX when performing large scale Enterprise Forensics and Incident Response. I also tend to see HX or other EDR solutions on organizations with mature security operations that use such technology to increase endpoint visibility and improve their capabilities to detect and respond to threats on the endpoints. HX is very powerful,  feature rich but like many EDR products it tends to be designed for more seasoned incident responders with specialized skill set. HX can be used in the realm of protection, detection, and response. Today’s notes are primarily focused on two things: Increase awareness about tools that will help augment HX capability to detect attacks; Increase awareness about tools that will help the analyst ability to work with the results. Goal is to improve threat detection and ability to analyze the results therefore increase the effectiveness of your product and maximize the outcome of your investigations.

FireEye makes available a website named fireeye.market where one can download apps that extend the functionality of existing products. If you are a FireEye customer you likely have seen this before. For this post I’m looking at the Endpoint Security apps that might extend the functionality of the HX or enhance the analyst ability to perform the work faster/better.  On the FireEye Market website there are a few things that are freeware and can be downloaded without subscription. Others may require a subscription. One of the main freeware tools is the IOC Editor. Let’s briefly go over some of the things that will be useful.

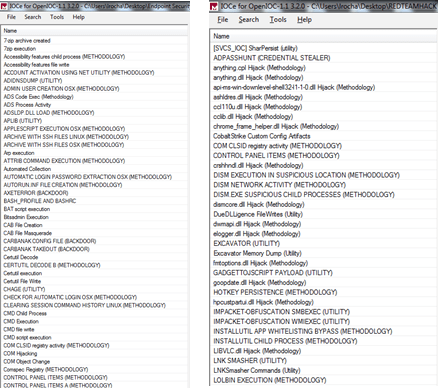
Indicators of Compromise (IOC) Editor is a free tool for Windows that provides an interface for managing data and manipulating the logical structures of IOCs. IOCs are XML documents that help incident responders capture diverse information about threats, including attributes of malicious files, characteristics of registry changes, artifacts in memory, etc.  There are two versions of IOC editor in the website. We want the IOC 1.1 editor version 3.2. The installation file Mandiant IOCe.msi can be downloaded from here  https://fireeye.market/apps/211404 . The archive is IOCe-3.2.0-Signed.msi.zip (3EE56F400B4D8F7E53858359EDA9487C). This version brings updated IOC terms that allow us to create IOCs for HX real-time alerting and for searching the contents of the HX event buffer (ring buffer). Note that Redline does not support IOC 1.1. If you are a developer or interested in the details IOC 1.1 specification you can look here https://github.com/mandiant/OpenIOC_1.1. This schema is what Mandiant services uses internally to extend functionality of IOC Editor and support new and extended terms. The IOC editor contains two main set of terms: On one hand you have the terms that can be used to search for historical artefacts (Sweep) and on the other hand you have the terms that can be used to search event buffer (Real-Time) or generate real time alerts. All terms are created with a set of conditions and logic needed to describe and codify the forensic artefacts.

OpenIOC2HXIOC

When you use IOC editor to create, edit, maintain your Real-Time IOCs you need to upload them to HX either for testing or to be on released on production. One way to accomplish this is to use the Python script that takes IOCs as input and uploads them into HX to be used on Real Time alerting. This script can be downloaded from https://fireeye.market/apps/213060. You will need Python and a HX user account with API rights because the script takes advantage of the HX API to perform the work.

HXTOOL

HXTool, originally created by Henrik Olsson in 2016, is a web-based, opensource, standalone tool written in python. that can be used with HX. HXTool provides additional features not directly available in the product GUI by leveraging FireEye Endpoint Security’s rich API. Since the code now is open source, this tool is an excellent example of how you can develop applications utilizing the Endpoint Security REST API. It is available in FireEye’s public GitHub at https://github.com/fireeye/HXTool.

After installation, open a webbrowser and point it to localhost on port 8080. In the HXTool create a new profile with the IP address and port of the HX controller. Then connect with a user that has API Admin rights and was previously created in the HX management interface. There are many features in HX tool but the ability to use Script Builder to create audit scripts allows you fully leverage the potential of HX. After you create a script you run Sweeps using the bulk-acquisition method. The Sweeps can be used to perform enterprise forensics at scale or to look for real time data stored in the ring buffer of the endpoints. Nonetheless, you can use HXTool to perform stack analysis, enterprise searches based on OpenIOC 1.1, create, and maintain the Real-Time indicators, etc.

$ git clone https://github.com/fireeye/HXTool
Cloning into 'HXTool'...
remote: Enumerating objects: 6401, done.
remote: Counting objects: 100% (90/90), done.
remote: Compressing objects: 100% (70/70), done.
remote: Total 6401 (delta 39), reused 55 (delta 20), pack-reused 6311
Receiving objects: 100% (6401/6401), 14.64 MiB | 5.08 MiB/s, done.
Resolving deltas: 100% (4337/4337), done.  
$cd HXTool/   $ pip install -r requirements.txt --user
(..)
Installing collected packages: itsdangerous, MarkupSafe, Jinja2, click, Werkzeug, flask, pycryptodome, tinydb, six, python-dateutil, numpy, pytz, pandas Successfully installed Jinja2-2.11.2 MarkupSafe-1.1.1 Werkzeug-1.0.1 click-7.1.2 flask-1.1.2 itsdangerous-1.1.0 numpy-1.16.6 pandas-0.24.2 pycryptodome-3.9.7 python-dateutil-2.8.1 pytz-2020.1 six-1.15.0 tinydb-3.15.2    
$ python3 hxtool.py
(..)
[2020-06-02 01:39:41,497] {hxtool} {MainThread} INFO - Application starting
[2020-06-02 01:39:41,501] {hxtool} {MainThread} INFO - Application is running. Please point your browser to https://0.0.0.0:8080. Press Ctrl+C/Ctrl+Break to exit.  
* Serving Flask app "hxtool" (lazy loading)  
* Environment: production   
WARNING: This is a development server. Do not use it in a production deployment.    Use a production WSGI server instead.  
* Debug mode: off

Supplementary  IOCs

In the FireEye market website, there are a set of FireEye released Real-Time IOCs designed to supplement FireEye Endpoint Security’s production indicators. They were created for environment-specific detection and testing, like tests based on MITRE’s ATT&CK framework. Most of these IOCs will require substantial tuning to use in a production environment. They need to be customized for your environment and should not be uploaded in bulk. This set contains more than 400 IOCs and can be obtained from https://fireeye.market/apps/234563

FireEye Red Team IOCs.  Last December as result of an incident, FireEye released a set of IOCs to detect FireEye Red Team tools. These IOCs empower the community to detect these tools and are available in different formats including OpenIOC, Yara, Snort, and ClamAV. There are more than 80 IOCs in OpenIOC format and can be downloaded from https://github.com/fireeye/red_team_tool_countermeasures

The first set of IOCs are very broad and need to be customized for a particular environment but they offer a starting point for security teams to test and get familiar with the process. The lifecycle of designing, building, deploying, and adopting IOCs is part of the Security monitoring and/or Incident Response capability where well trained and well equipped personnel alongside with consistent and well defined process come into play. If you want to be able to run sophisticated threat hunting missions you first should be able to understand the threat, understand the indicators that help you identify the threat in your network and then you can create and maintain IOCs that may represent that threat. The second set of IOCs are overall very good but some of them need tunning specially the LOLBINs and the suspicious DLL executions.

GOAUDITPARSER

So, by now, with the things that were covered, you have a set of IOCs that you uploaded to HX using the OpenIOC2HXIOC script and you used the HXTool to Sweep your environment to look for threats or you used them to generate Real-Time alerts. But how to analyze the results? Traditionally you likely used the HX GUI or downloaded the data and used Redline. However, we can now use some other technique.  Daniel Pany just recently open sourced GoAuditParser. A versatile and customizable tool to help analysts work with FireEye Endpoint Security product (HX) to extract, parse and timeline XML audit data. People have used Redline to parse and create a timeline of the data acquired with HX but using this tool an analyst may be able to improve his ability to perform analysis on the data at scale obtained via HX. The compiled builds of the tool can be downloaded from https://github.com/fireeye/goauditparser/releases/tag/v1.0.0. Danny has published extensive documentation on how to use the tool on GitHub.

GAP_4_1_4

That’s it for today. If you use HX you can now improve your investigation methods using the mentioned tools. Consider and think about the following 3 steps:

  • Based on leads or alerts you collect Live Response data
    • Use HXTool Script Builder to create a script to acquire Live Response Data
    • Use HXTool to run a Bulk Acquisition to run the acquisitions of Live Response data
    • Download the Live Response Acquisition using HXTool
  • Analyze results & develop timeline
    • Use GoAuditParser to extract, parse and timeline the results.
    • Perform the forensic investigation by interpreting the results
    • Use your favorite tool to create a timeline (likely Excel)
  • Design, build, deploy and adopt Real-Time IOCs and Sweep IOCs
    • Use IOC editor to build IOCs that represent your findings
    • Use IOC editor to create IOCs for both Sweeps and Real-Time
    • Deploy Real-Time IOCs using OpenIOC2HXIOC
    • Create Sweeps with HXTool using Script Builder, Job Filters in conjunction with IOCs to filter results and BulkAcquistions.
  • Repeat

Hopefully this short summary increases the awareness on how to use HX more efficiently. It also serves to capture a perspective on how to use HX because you can use such tools to handle real security incidents and intrusions at enterprise level.

References:

Endpoint Security Server User Guide Release 5.0.2
Endpoint Security Server System Administration Guide Release 5.0.2
IOC Editor 2.2.0.0 User Guide


Tagged , , , , ,

Notes on Linux Memory Analysis – LiME, Volatility and LKM’s

[The post below contains some notes I wrote about Linux memory forensics using LiME and Volatility to analyze a Red Hat 6.10 memory capture infected with Diaphormine and Reptile, two known Linux Kernel Module rootkits.]

Back in 2011, Joe Sylve, Lodovico, Marziale, Andrew Case, and Golden G. Richard published a research paper on acquiring and analyzing memory from Android devices “Acquisition and analysis of volatile memory from android devices” [1]. At Shmoocon 2012, Joy Sylve gave a presentation titled “Android Mind Reading: Memory Acquisition and Analysis with DMD and Volatility“[2]. This work was the precursor of Linux Memory Extractor aka LiME [3]. LiME is an open source tool, created by Joy Sylve, that allows incident responders, investigators and others to acquire a memory sample from a live Linux system.

Some years before, The Volatility Framework was developed based on the research that was done by AAron Walters and Nick Petroni on Volatools [4] and FATkit [5]. The first release of the Volatility Framework was released in 2007. In 2008 the volatility team won the DFRWS challenge [6] and the new features were added to Volatility 1.3.  At the moment, Volatility is a powerful, modular and feature rich framework that combines a number of tools to perform memory analysis. The framework is written in Python and allows plugins to be easily added in order to add features. Nowadays it is on version 2.6.1 and version 3 is due this month. It supports a variety of operating systems. To analyze memory captures from Linux systems, Andrew Case, in 2011 [7], introduced several techniques into the Volatility framework in order to analyze Linux memory samples. Since then, new plugins have been introduced and different kernel versions are supported. At the moment there are 69 Linux plugins available.

Worth to mention that Michael Hale Ligh, Andrew Case, Jamie Levy, AAron Walters wrote the book “The Art of Memory Forensics Detecting Malware and Threats in Windows, Linux, and Mac Memory” that was published by Wiley in 2014 and is a reference book in this subject.

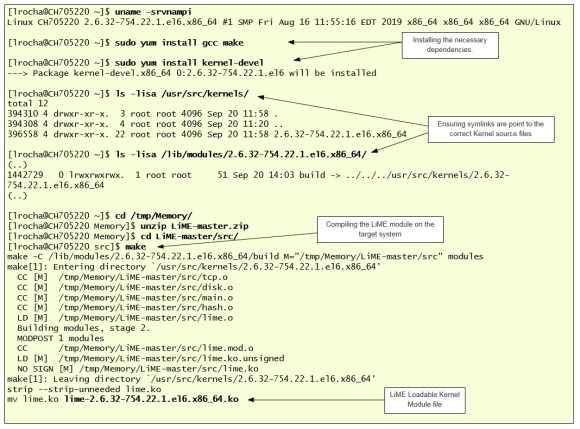
LiME works by loading a kernel driver on the live system and dump the memory capture to disk or network. The only catch is that the loadable kernel module needs to be compiled for the exact version of the kernel of the target system. Volatility is then be able to interpret this memory capture, but it needs a profile that matches the system from where the memory was acquired. Building a Volatility profile is straightforward, but it requires kernel’s data structures and debug symbols obtained for the exact kernel version of the target system obtained using the dwardfump utility.  This means that if you want to acquire a memory capture from a system in an enterprise, the incident response team will need to transfer LiME and Volatility code to the system and compile it in order to create the required files. Sometimes the target system won’t have the necessary dependencies and additional packages will need to be installed such as compilers, DWARF libraries, ELF utilities, Kernel headers, etc. This is a sensible step from a forensic standpoint. Hal Pomeranz, experienced forensics professional, has a few comments about this on the readme file from his Linux Memory Grabber utility [8].

In an ideal world all the requirements necessary to have LiME kernel module and Volatility profile for all your Linux kernel versions will be done in advance. This can be done and should be done during the preparation phase [9] of your incident response process. This phase/step is when incident response team prepares and trains for an incident. One thing that can be done is creating LiME modules and Volaility profiles for the Kernel versions of the systems that are running in production. This can be done directly on the system or on a pre-production system. Of course, I can tell you that based on my experience, this hardly happens. Its more common the case when an incident happens i.e., an attacker used a Linux system in an enterprise environment as a staging environment or used it to achieve persistence or use it to pivot into other network segments, there are no LiME kernel modules or Volatility profiles for the compromised system. Yes, the incident response team acquires live response data or a forensic image of the disk but the acquisition of memory can aid the investigation efforts.

During enterprise incident response its common to come across the need to analyze commercial Linux systems such as Red Hat that are running business applications. In this article I will be looking at a RedHat Enterprise Linux Server release 6.10 with code name Santiago.

The following illustration shows the steps for compiling LiME on the target system. I start by checking the Kernel version following by installing the necessary dependencies on this particular system. The LiME package can be retrieved from GitHub and can be made available to the target system using removable media, a network file share, or by copying into the system. Compiling LiME is an easy step.

Next step is to run LiME with the insmod command. This step will acquire a memory sample in LiME format and in this case I also told LiME to produce a hash of the acquired memory sample. As an example the memory capture is written to disk but in a real incident is should be written to a network share, removable media sent via the network. Finally, you can remove the module with rmmod.

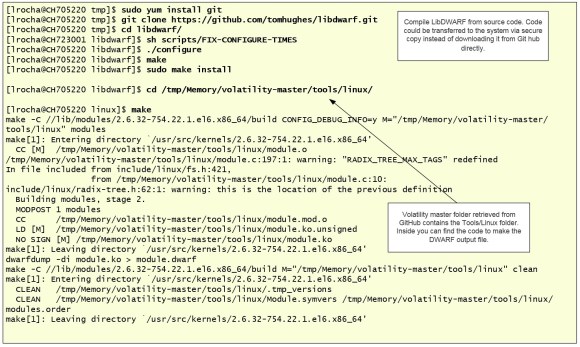
After that, we need a Volatility profile for the Linux kernel version we are dealing with. On this version of RedHat I could not find a RPM for Libdwarf that contained the Dwarf tools. I had to get the source code from GitHub and transfer it to the system and compile it. Then, with the dependencies met I could compile and make the dwarf module.

Finally, I acquired the system-map file and zipped it together with module.dwarf. This zip file needs to be placed in the volatility profiles folder or you can place it on a different folder and specify it in the command line.

Now that I have a profile for the Linux system that I can try different Volatility plugins. In this particular case I was interested in determining what I could observe when looking with Volatility on a memory capture from the system after it has been backdoored with publicly available rootkits. There are several Volatility plugins for Volatility that can help identifying rootkits [10]. Let’s review three that might help with rootkits that leverage Linux Kernel Modules..

The linux_check_modules plugin. This plugin will look for kernel loadable modules that are not listed under /proc/module but still appear under /sysfs/module and will show the discrepancies. There is also the linux_hidden_modules which will look at the kernel memory region where modules are allocated and scans for module structures. Modules appearing with this plugin might indicate they were released but still laying in memory or they are hiding.

The linux_check_syscall plugin. This plugin will check if the sys_call_table has been modified. It lists all syscall handler function pointers listed in the sys_call_table array and it compares them with the address specified in the Kernel Symbols Table. If they don’t match, the message hook will be displayed.

The linux_check_kernel_inline plugin. This plugin will detect inline hooking. Among other things it will check if the prologue of specific functions in the kernel contains assembly instructions like JMP, CALL or RET. A match will display a message about the function that is being hooked.

In terms of Rootkits that leverage Loadable Kernel Modules I will look into Diamorphine [11] and Reptile [12]. Essentially, infecting the Red Hat system with the rootkit and capture a memory sample.

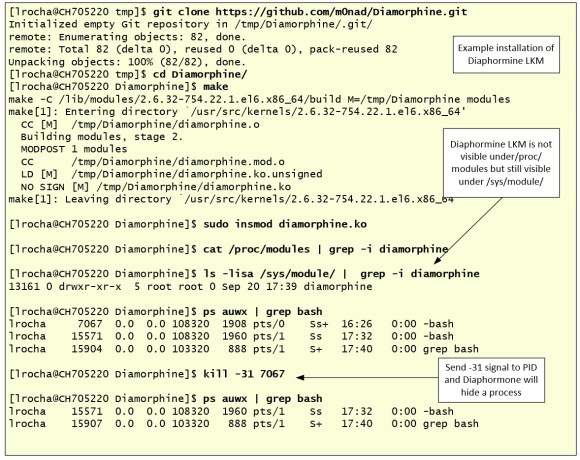
Let’s start with Diamorphine. Written by Victor Mello is a kernel rootkit written in C that supports Linux Kernels 2.6.x/3.x/4.x. It can hide processes, files and directories. It works by hooking the sys_call_table, more specifically it hooks the kill, getdents and getdents64 syscall handler addresses, making them point to the Diaphormine code. After loading into memory, the LKM module won’t be visible in /proc/modules but is still visible under /sys/module.

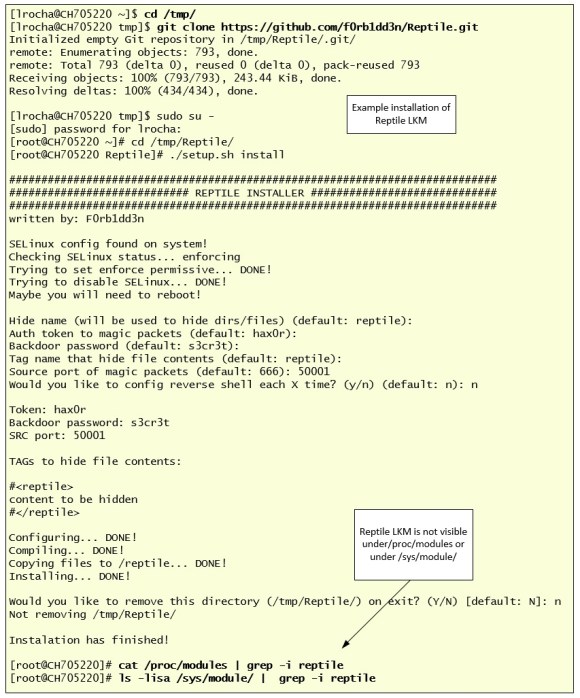
The following illustration shows, as an example, the Reptile installation on a Red Hat 6.10 system. It also shows that after the insertion of the malicious module into the Kernel, it doesn’t appear under /proc/modules. There is also a step on hiding a PID referent to bash process.

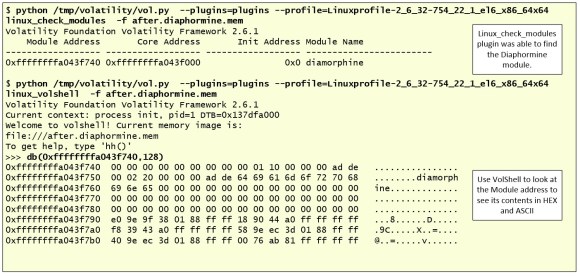
Following the previous steps, another memory sample was captured, and I ran the linux_check_modules Volatility plugin. As we could see, the plugin was able to find the Reptile module because he was still visible under /sysfs/module. We could dump the module to disk using the linux_moddump (didn’t worked for me at the time I tried it) and perform additional analysis in case this was something we were uncertain about. In this case I just looked at the first bytes of the module using linux_volshell plugin. The Volshell plugin was created in 2008 by Brendan Dolan-Gavitt. Following ilustration shows the usage of VolShell to print out 128 bytes in ASCII and look for interesting strings.

The other plugin worth to run is linux_check_syscall, which in this case is able to detect three hooked syscalls. Syscall 62, 78 and 217 which we can match against the syscall table from the pristine system, by looking at /proc/kallsyms, and check that the number corresponds to sys_kill, sys_getdents and sys_getdents64, respectively. Following that, and from a analysis perspective, I could use VolShell on the pristine memory dump and also on the one that has Diaphormine LKM loaded. Then I could list a few bytes in Assembly to compare and understand how good and bad looks like. In the following picture, on the left side, you can see the good sys_kill function and on the left side the bad one. Basically the syscall handler address was modified to point to the Diaphormine code.

The other rootkit that is worth to look at is Reptile. It was written by Ighor Augusto and is a feature rich rootkit with features like port knocking. It is written in C and under the hood it uses the Khook framework. You can see the presentation “Linux Kernel Rootkits Advanced Techniques” from Ilya Matveychikov and Ighor Augusto that was given during H2HC 2018 [13] conference at São Paulo, Brasil where Reptile was released. Khook, among other things, instead of hooking the sys_call_table it uses a different technique that patches a function prologue with a JMP instruction. With the Volatility linux_check_syscal plugin we can’t detect this hooking technique since the syscall handler addresses have not been modified but it can be identified with linux_check_kernel_inline. Among other things, Reptile hooks fillonedir(), filldir(), filldir64(), compat_fillonedir(), compat_filldir(), compat_filldir64(), __d_lookup(). To hide processes, it hooks tgid_iter() and next_tgid(). To hide network connections, it hooks tcp4_seq_show and udp4_seq_show.

The following illustration shows, as an example, the Reptile installation on a Red Hat 6.10 system.

After compromising a system with Reptile and acquiring a memory capture, I executed the mentioned plugins. I started with linux_hidden_modules to look for LKM structures in the Kernel Memory. Volatility was able to find the Reptile LKM. Then we could dump the module to disk and perform additional static analysis.

The other plugin executed is linux_check_inline_kernel. It was able to detect several network related functions that were patched by the Reptile code. I didn’t had time to further investigate why the Hook Address is not shown but we can get futher details with Volshell.

The following picture shows a comparison of a good tcp4_seq_show function on the left side from a memory capture of a pristine system and, on the right, it shows the same function but as we could see it has been patched to jump (JMP) to the Reptile code.

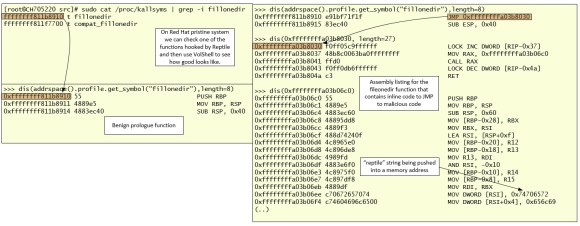
Another function that is patched by Reptile code in order to hide directories is the filleonedir. Not sure why Volatility didn’t detected this but the plugin might be easily adjustable to perform further checks and detect it. On the image below, on the left side, I used Volshell to check the function prologue on a pristine system. On the right side, we can see how the patched function looks like.

That’s it for today. In this post I shared some notes on how to use different Volatility plugins to detect known Rootkits that leverage Linux Kernel Modules. The memory capture was obtained using LiME and and instructions were given on how to acquire the memory capture and create a Volatility profile. Nothing new but practice these kind of skills, share your experiences, get feedback, repeat the practice, and improve until you are satisfied with your performance. Have fun!

[1] http://www.dfir.org/research/android-memory-analysis-DI.pdf

[2] https://www.youtube.com/watch?v=oWkOyphlmM8

[3] https://github.com/504ensicsLabs/LiME

[4] https://www.blackhat.com/presentations/bh-dc-07/Walters/Paper/bh-dc-07-Walters-WP.pdf

[5] http://4tphi.net/fatkit/papers/fatkit_journal.pdf

[6] http://volatilesystems.blogspot.com/2008/08/pyflagvolatility-team-wins-dfrws.html

[7] http://dfir.org/research/omfw.pdf

[8] https://github.com/halpomeranz/lmg

[9] https://nvlpubs.nist.gov/nistpubs/SpecialPublications/NIST.SP.800-61r2.pdf

[10] https://github.com/volatilityfoundation/volatility/wiki/Linux-Command-Reference

[11] https://github.com/m0nad/Diamorphine

[12] https://github.com/f0rb1dd3n/Reptile/

[13] https://github.com/h2hconference/2018/

References:

SANS FOR526: Advanced Memory Forensics & Threat Detection

The Art of Memory Forensics Detecting Malware and Threats in Windows, Linux, and Mac Memory

Tagged , , , , , ,

Digital Forensics – PlugX and Artifacts left behind

When an attacker conducts an intrusion using A, B or C technique, some of his actions leave artifact X, Y or Z behind. So, based on the scenario from the last article about PlugX, I collected a disk image and memory image from the domain controller. Over the past years I wrote several articles on how to perform acquisition, mounting and processing of such images and analyze them by creating super timelines, look at different artifacts like Event Logs, Prefetch, ShimCache, AMCache, etc., or analyze NTFS metadata or look for artifacts related to interactive sessions. Today, I’m not going to perform analysis but I’m going to list a quick overview about some of the Windows endpoint artifacts that might give us evidence about the actions that were executed in the previous scenario and help us produce a meaningful timeline. In addition, I list some tools that could be used to analyze those artifacts.

Scenario 1: The attacker placed the filename “kas.exe” on the folder “c:\PerfLogs\Admin”. Which artifacts could record evidence about this action?

  • NTFS MFT
    • Description: The Master File Table (MFT) is a special system file that resides on the root of every NTFS partition. The file is named $MFT and is not accessible via user mode API’s but can been seen when you have raw access to the disk e.g, forensic image. This special file is a hierarchical database and inside you have records that contains a series of attributes about a file, directory and indicates where it resides on the physical disk and if is active or inactive. The size of each MFT record is usually 1024-bytes. Each record contains a set of attributes. Some of the most important attributes in a MFT entry are the $STANDART_INFORMATION, $FILENAME and $DATA. The first two are rather important because among other things they contain the file time stamps. Each MFT entry for a given file or directory will contain 8 timestamps. 4 in the $STANDARD_INFORMATION and another 4 in the $FILENAME. These time stamps are known as MACE.
    • Tools: Parse and analyze it with SleuthKit originally written by Brian CarrierMFT2CSV from Joakim Schicht or PLASO/log2timeline originally created by Kristinn Gudjonsson
  • NTFS INDX Attribute
    • Description: The MFT records for directories contain a special attribute called $I30. This attribute contains information about file names and directories that are stored inside a directory. This special attribute is also known as $INDX and consists of three attributes, the $INDEX_ROOT, $INDEX_ALLOCATION and $BITMAP. So, What? Well, this attribute stores information in a B-tree data structure that keeps data sorted so the operating system can perform fast searches in order to determine if a file is present. In addition, this attribute grows to keep track of file names inside the directory. However, when you delete a file from a directory the B-tree re-balances itself but the tree node with metadata about the deleted file remains in a form of slack space until it gets reused. This means we can view the $I30 attribute contents and we might find evidence of files that once existed in a directory but are no longer there.
      Tools: o Parse it and analyze it with INDXParse from William Ballenthin or MFT2CSV from Joakim Schicht.
  • NTFS $LogFile
    • Description: NTFS has been developed over years with many features in mind, one being data recovery. One of the features used by NTFS to perform data recovery is the Journaling. The NTFS Journal is kept inside NTFS Metadata in a file called $LOGFILE. This file is stored in the MFT entry number 2 and every time there is a change in the NTFS Metadata, there is a transaction recorded in the $LOGFILE. These transactions are recorded to be possible to redo or undo file system operations. After the transaction has been logged then the file system can perform the change. When the change is done, another transaction is logged in the form of a commit. The $LOGFILE allows the file system to recover from metadata inconsistencies such as transactions that don’t have a commit. The size of the $LOGFILE can be consulted and changed using chkdsk /l and per default is 65536 KB. Why would $LOGFILE be important for our investigation? Because the $LOGFILE keeps record of all operations that occurred in the NTFS volume such as file creation, deletion, renaming, copy, etc. Therefore, we might find relevant evidence in there.
    • Tools: Parse it and analyze it with LogFileParser from Joakim Schicht
  • NTFS $UsnJrnl
    • Description: The change journal contains a wealth of information that shouldn’t be overlooked. Another interesting aspect of the change journal is that allocates space and deallocates as it grows and records are not overwritten unlike the $LogFile. This means we can find old journal records in unallocated space on a NTFS volume. How to obtain those? Luckily, the tool USN Record Carver written by PoorBillionaire can carve journal records from binary data and thus recover these records
    • Tools: Parse and analyze it with UsnJrnl2Csv from Joakim Schicht or from unallocated space with USN Record Carver from PoorBillionaire.

Scenario 2: Which account did the attacker used to log into the system when he placed “kas.exe” on the file system?

  • Windows Event Logs
    • Description: The Windows Event logs record activities about the operating system and its applications. What is logged depends on the audit features that are turned thus impacting the information that one can obtain. From a forensic perspective the Event Logs capture a wealth of information. The main three Windows Event Logs are Application, System, and Security and on Windows Vista and beyond they are saved on %System32%\winevt\Logs in a binary format. For example the Event id’s 4624, 4625 might give us answers.
    • Tools: Parse it and Analyze it with PLASO/Log2timeline, LibEvtx-utils from Joakim Schicht , python-evtx from William Ballenthin or Event Log Explorer. You likely get better results if in your environment if you have consistent and enhanced audit policy settings defined that track both success and failures. In case the attacker  deletes the Windows Event Logs, there is the possibility to recover Windows Event Log records from the pagefile.sys or from unallocated space, from Volume Shadow copies or even the system Memory. You could use EVTXtract from Willi Ballenthin to attempt to recover Event logs from raw data.

Scenario 3: Attacker executed the “kas.exe” binary. Which artifacts might record this evidence?

  • Windows Prefetch / Superfetch
    • Description: To improve customer experience, Microsoft introduced a memory management technology called Prefetch. This functionality was introduced into Windows XP and Win-dows 2003 Server. This mechanism analyses the applications that are most frequently used and preloads them in advance in order speed the operating system booting and application launching. On Windows Vista, Microsoft enhanced the algorithm and introduced SuperFetch which is an improved version of Prefetch. The Prefetch files are stored in %SYSTEMROOT%\Prefetch directory and have a .pf extension. The Superfetch files have a .db extension. Prefetch files keep track of programs that have been executed in the system even if the original file is no longer present. In addition Prefetch files can tell you when the program was executed, how many times and from which path.
    • Tools: PLASO/log2timeline, Windows-Prefetch-Parser from Adam Witt, Prefetch Parser from Eric Zimmerman. For Superfetch you could use SuperFetch tools.
  • ShimCache either from Registry or from Kernel Memory
    • Description: Microsoft introduced the ShimCache in Windows 95 and it remains today a mechanism to ensure backward compatibility of older binaries into new versions of Microsoft op-erating systems. When new Microsoft operating systems are released some old and legacy application might break. To fix this Microsoft has the ShimCache which acts as a proxy layer between the old application and the new operating system. A good overview about what is the ShimCache is available on the Microsoft Blog on an article written by Tim Newton “Demystifying Shims – or – Using the App Compat Toolkit to make your old stuff work with your new stuff“. The interesting part is that from a forensics perspective the ShimCache is valuable because the cache tracks metadata for binary that was executed and stores it in the ShimCache.
    • Tools: From Kernel memory, you can parse it and analyze it with Volatility ShimCache and ShimCacheMem plugin. From the Registry you can use ShimCacheParser https://github.com/mandiant/ShimCacheParser. You can also use RegRipper from Harlan Carvey or AppCompatCacheParser from Eric Zimmerman. In addition, to analyze ShimCache artifacts at scale you can use AppCompatProcessor from Mattias Bevilacqua,
  • AMCache
    • Description: On Windows 8, Amcache.hve replaced the RecentFileCache.bcf file, a registry file used in Windows 7 as part of the Application Experience and Compatibility feature to ensure compatibility of existing software between different versions of Windows. Similar to its predecessor, Amcache.hve is a small registry hive that stores a wealth of information about recently run applications and programs, including full path, file timestamps, and file SHA1 hash value. Amcache.hve is commonly found at the following location: C:\Windows\AppCompat\Programs\Amcache.hve. The Amcache.hve file is standard within the Windows 8 operating system, but has been found to exist on Windows 7 systems as well.
    • Tools: To read the amcache HIVE you could use RegRipper or Willi Ballenthin stand-alone script or Eric Zimmerman AmcacheParser. To analyze AMCache artifacts at scale you can use AppCompatProcessor from Mattias Bevilacqua,
  • Windows Event Logs. 
    • The Windows Event logs – for example id 4688 – could track binary execution if you have the proper audit settings or you use Sysmon.

Scenario 4: The execution of “kas.exe” dropped three files on disk that used DLL Search Order Hijacking to achieve persistence and install the malicious payload. Which artifacts might help identifying this technique?

Identifying evidence of DLL Search Order hijacking is not easy if no other leads are available. Likely you need a combination of artifacts. The following artifacts / tools might help.

  • NTFS MFT, INDX, $LogFile, $UsnJrnl.
  • Prefetch / SuperFetch.
  • ShimCache either from Registry or from Kernel Memory.
  • AMCache.
  • Windows Event Logs could track process execution and give you leads if you have the proper audit settings or you use Sysmon
  • Volatility to perform memory analysis.
  • RegRipper – One thing you could try, among many others that this powerful tool allows,is to identify different persistence mechanism that could have resulted as part of the DLL Search Order Hijacking technique.
  • AppCompatProcessor to analyze ShimCache and AMCache at scale combined with with PlugX signatures.

Scenario 5: The PlugX dropped files have the NTFS timestamps manipulated i.e., It copies the timestamps obtained from the operating system filename ntdll.dll to set the timestamps on the dropped files. What artifacts could be used to detect this?

The time modification will cause a discrepancy between the NTFS $STANDART_INFORMATION and $FILENAME timestamps. You could combine the NTFS artifacts with the execution artifacts to spot such anomalies.  Other technique you could use is with AppCompat Processor which has the Time Stomp functionality that will search for appcompat entries outside of the Windows,  System and SysWOW64 folders with last modification dates matching a list of known operating system files.

Scenario 6: Attacker used the PlugX controller to Invoke a command shell and execute Windows built-in commands. Are there any artifacts left behind that could help understand commands executed?

  • ShimCache either from Registry or from Kernel Memory.
  • Memory analysis with Volatility and look for Process creation, Console History, cmdscan or consoles plugin.
  • The Windows Event logs could track process execution if you have the proper audit settings or you use Sysmon.

Scenario 7: Attacker established a persistence mechanism either using a Service or Registry Key. 

  • Producing a timeline of the Registry would help identify the last modification dates of the registry keys. You could use RegRipper from Harlan Carvey or RECmd from Eric Zimmerman. The Windows Event logs would also help in case the there was a service created on the operating system. For example Event ID 7009, 7030, 7035, 7036, 7040, 7023 or 7045 could help. In addition, to list the services and its properties you could perform memory analysis with Volatility or use RegRipper.

Scenario 8: The attacker accessed the Active Directory database using the “ntdsutil.exe” command. What could be used to detect this activity?

  • As we saw previously, command execution could be identified using ShimCache either from Registry or from Kernel Memory. Because “ntdsutil.exe” would be executed on a Server system, Prefetch won’t help here because its not enabled on Server systems. One of the most usefull artifacts would be the Windows Event logs but you need to have the right settings so it could track binary execution and the interactions with the Active Directory. One thing that might help in case the memory image has been acquired not long after the attacker activity is to perform memory analysis and creating a timeline of the artifacts with Volatility might help identifying the process creation and its parent(s). In addition, you might get interesting leads just by running strings (little and  big endian) on the pagefile.sys. Other than that, the execution of “ntdsutil.exe” the way it was executed on the scenario, leaves behind artifacts on the NTFS metadata.

That’s it for today. With this article I presented a quick listing on some artifacts and tools that can help you perform forensic analysis on a system and help you answer your investigative questions. Many other tools and artifacts would be available depending on the attacker activities, for example if the attacker logged into a system interactively, but the ones listed might give you a starting point and might help you understand what happened and when. One thing that would greatly complement the findings of a system forensic analysis the network data such as the ones that comes from Firewall, Router, IDS or Proxy logs or any other kind of networking logs you might have. Specially if attacker is using a C2 and is clearing evidence such as the threat group that used a file named “a.bat” to clean several artifacts as illustrated on the “Paranoid PlugX” article written by Tom Lancaster and Esmid Idrizovic from Unit 42.

Happy hunting and If you have dealt with a security incident where PlugX was used, please leave your comments about the tools or techniques you used to detect it.

Tagged , , , , , , , , , ,

Malware Analysis – PlugX – Part 2

Following my previous article on PlugX, I would like to continue the analysis but now use the PlugX controller to mimic some of the steps that might be executed by an attacker. As you know the traditional steps of an attack lifecycle follow, normally, a predictable sequence of events i.e., Reconnaissance, initial compromise, establish foothold, escalate privileges, internal reconnaissance, move laterally, maintain persistence, complete mission. For sake of brevity I will skip most of the steps and will focus on the lateral movement.I will use the PlugX controller and C2 functionality to simulate an attacker that established a foothold inside an environment and obtained admin access to a workstation. Following that, the attacker moved laterally to a Windows Domain Controller. I will use the PlugX controller to accomplish this scenario and observe how an attacker would operate within a compromised environment.

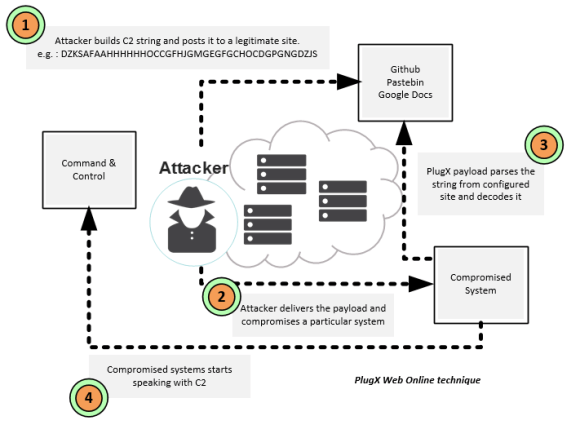
As we saw previously, the PlugX controller interface allows an operator to build payloads, set campaigns and define the preferred method for the compromised hosts to check-in and communicate with the controller. In the PlugX controller, English version from Q3 2013, an operator can build the payload using two techniques. One is using the “DNS Online” technique which allows the operator to define the C2 address e.g, an URL or IP address, that will be used by the payload to speak with the C2. The other method, is the “Web Online”, which allows the operator to tell the payload from where it should fetch the C2 address. This method allows the operator to have more control over the campaign. The following diagram illustrates how the “Web Online” technique works.

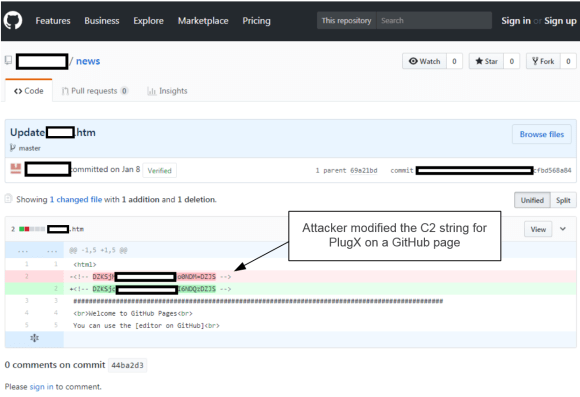
Why do I say this technique would allow an attacker to have more control? Consider the case that an organization was compromised by a threat actor that use this PlugX technique. In case the C2 is discovered, the impacted organization could block the IP or URL on the existing boundary security controls as a normal reaction to the concerns of having an attacker inside the network. However, the attacker could just change the C2 string and point it to a different system. In case the organization was not able to scope the incident and understand the TTP’s (Tools, Tactics and Procedures) then the attacker would still maintain persistence in the environment. This is an example that when conducting incident response, among other things, you need to have visibility into the tools and techniques the attacker is using so you could properly scope the incident and perform effective and efficient containment and eradication steps. As an example of this technique, below is a print screen from a GitHub page that has been used by an unknown threat actor to leverage this method.

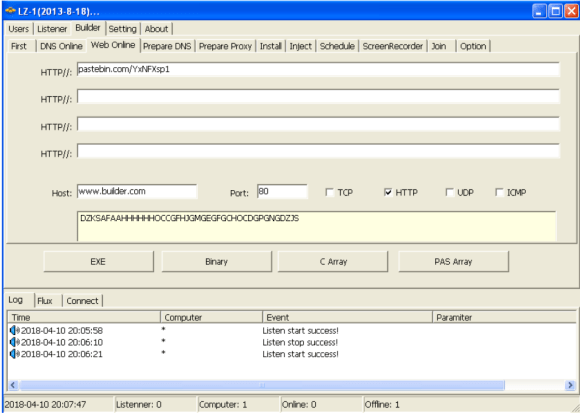
So, how to leverage this technique on the PlugX builder? The picture below shows how the operator could create a payload that uses the “Web Online” technique. The C2 address would be fetched from a specified site e.g. a Pastebin address, which on its turn would redirect the payload to the real C2 address. The string “DZKSAFAAHHHHHHOCCGFHJGMGEGFGCHOCDGPGNGDZJS” in this case is used to decode to the real C2 address which is “www.builder.com”. On the “PlugX: some uncovered points” article, Fabien Perigaud writes about how to decode this string. Palo Alto Unit42 gives another example of this technique on the “Paranoid PlugX” article. The article “Winnti Abuses GitHub for C&C Communications” from Cedric Pernet ilustrates an APT group leveraging this technique using GitHub.

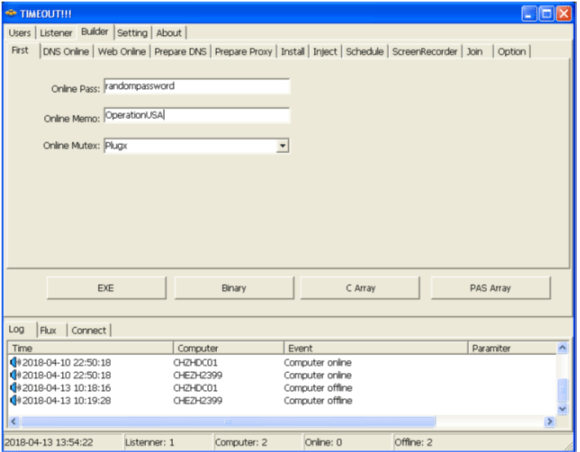
For sake of simplicity, in this article, I’m going to use the DNS Online technique using “www.builder.com” as C2 address. Next, on the “First” tab I specify the campaing ID and the password used by the payload to connect to the C2.

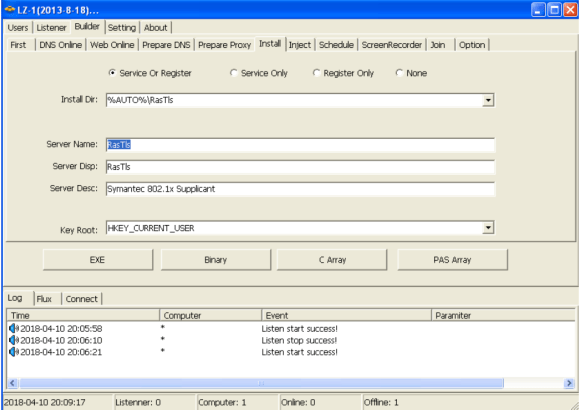
Next, on the Install tab I specify the persistence settings, in this case I’m telling the payload to install a service and I can specify different settings including where to deploy the binaries, the service name and service description. In addition, I can specify that if the Service persistence mechanism fails due to some reason the payload should install the persistence mechanism using the Registry and I can specify which HIVE should be used.

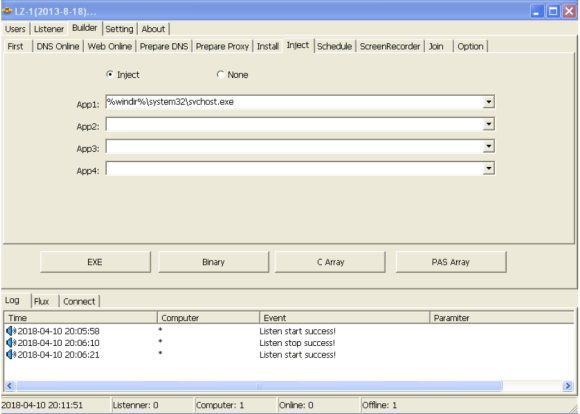
Then, In the inject tab I specify which process will be injected with the malicious payload. In this case I choose “svchost.exe”. This will make PlugX start a new instance of “svchost.exe” and then inject the malicious code into svchost.exe process address space using process hollowing technique.

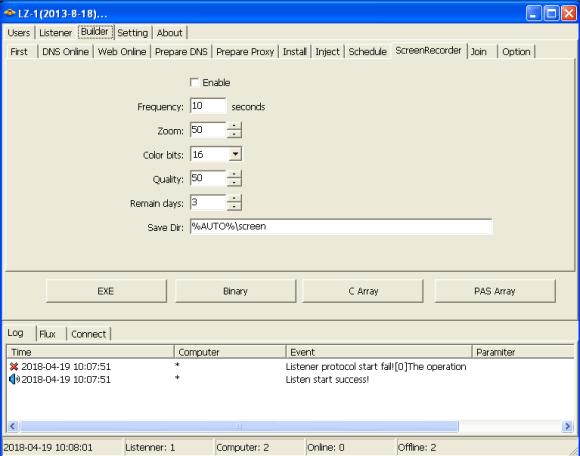
Other than that, the operator could define a schedule and determine which time of the week the payload should communicate with the C2. Also the operator could define the Screen Recording capability that will take screenshots at a specific frequency and will save them encrypted in a specific folder.

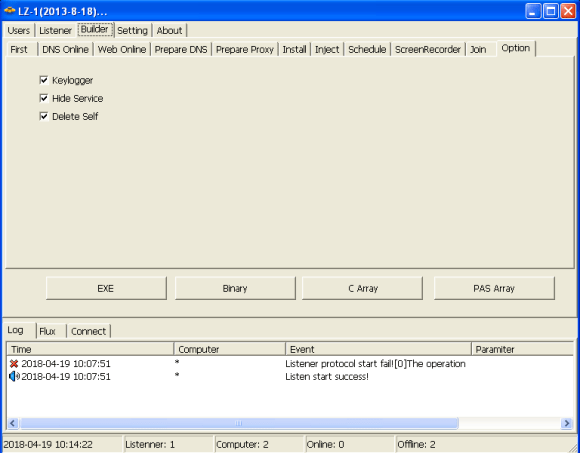
Last settings on the “option” tab allow the operator to enable the keylogger functionality and specify if the payload should hide it self and also delete itself after execution.

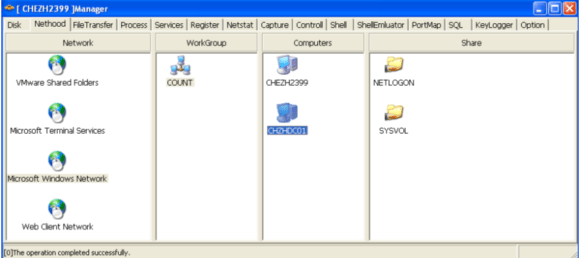
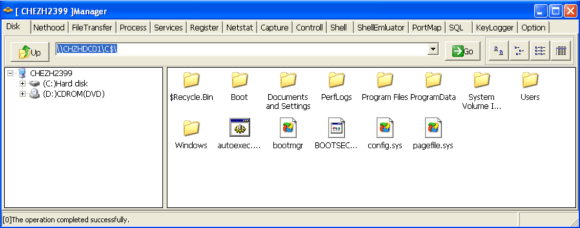
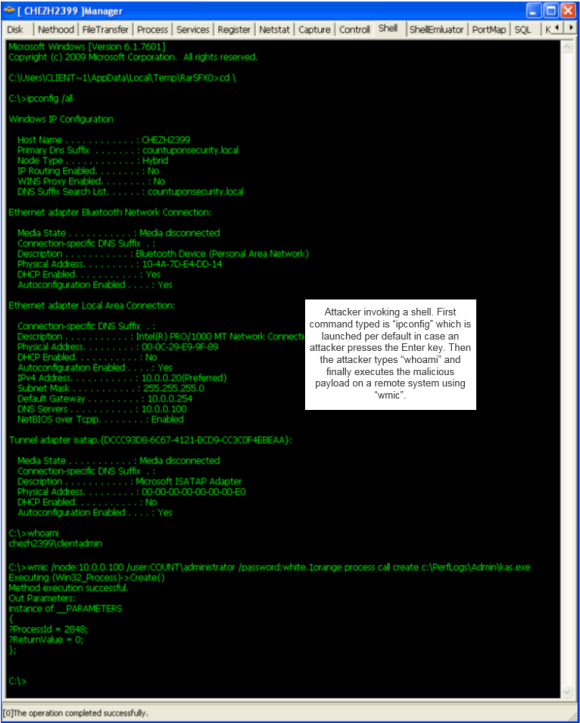
Finally, after all the settings defined, the operator can create/download the payload in different formats. An executable, binary form (Shellcode), or an array in C that can then be plugged in another delivery mechanism e.g, PowerShell or MsBuild. After deploying and installing the payload on a system, that system will check-in into the PlugX controller and an operator can call the “Manager” to perform the different actions. In this example I show how an attacker, after having compromised a system, uses the C2 interface to:

  • Browse the network

  • Access remote systems via UNC path

  • Upload and execute a file e.g., upload PlugX binary

  • Invoke a command shell and perform remote commands e.g., execute PlugX binary on a remote system

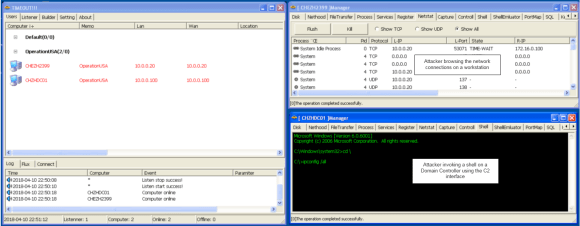
Previous pictures illustrate actions that the attacker could perform to move laterally and, for example, at some point in time, access a domain controller via UNC path, upload the PlugX payload to a directory of its choice and execute it. In this case the pictures show that the PlugX payload was dropped into c:\PerfLogs\Admin folder and then was executed using WMI. Below example shows the view from the attacker with two C2 sessions. One for one workstation and another for a domain controller.

Having access to a domain controller is likely one of the goals of the attacker so he can obtain all the information he needs about an organization from the Active Directory database.

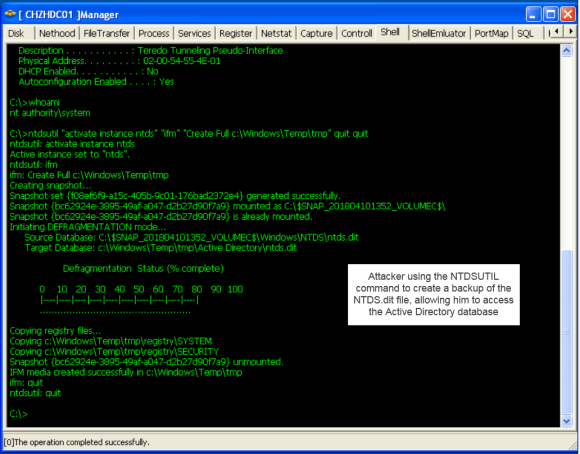
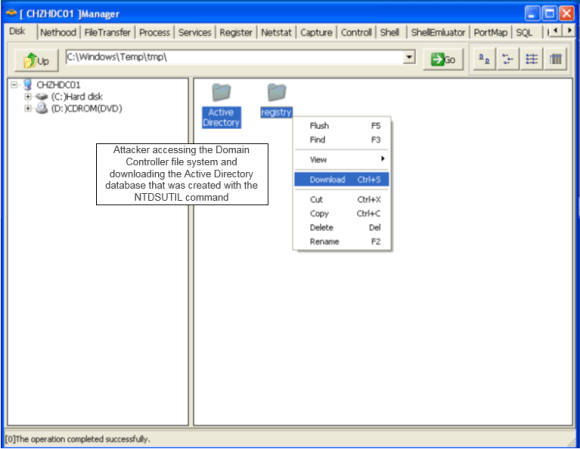
To access the Active Directory database, the attacker could, for example, run the “ntdsutil.exe” command to create a copy of the “NTDS.dit” file using Volume Shadow Copy technique. Then, the attacker can access the database and download it to a system under his control using the PlugX controller interface. The picture below illustrates an attacker obtained the relevant data that was produced using the “ntdsutil.exe” command.

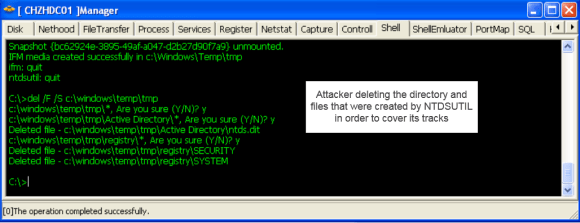
Finally, the attacker might delete the artifacts that were left behind on the file system as consequence of running “ntdsutil.exe”.

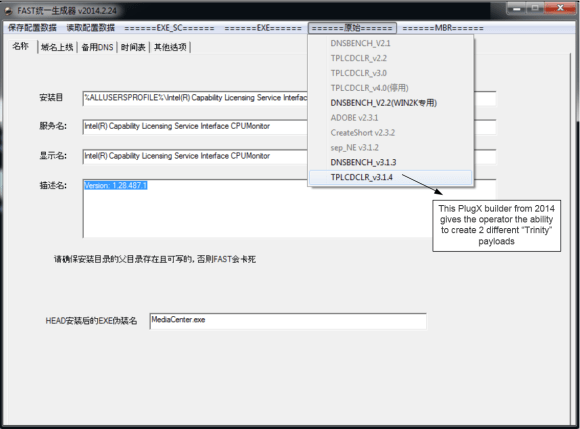
So, in summary, we briefly looked at the different techniques a PlugX payload could be configured to speak with a Command and Controller. We built, deploy and install a payload. Compromised a system and obtain a perspective from PlugX operator. We move laterally to a domain controller and installed the PlugX payload and then used a command shell to obtain the Active Directory database. Of course, as you noted, the scenario was accomplished with an old version of the PlugX controller. Newer versions likely have many new features and capabilities. For example, the print screen below is from a PlugX builder from 2014 (MD5: 534d28ad55831c04f4a7a8ace6dd76c3) which can create different payloads that perform DLL Search order hijacking using Lenovo’s RGB LCD Display Utility for ThinkPad (tplcdclr.exe) or Steve Gibson’s Domain Name System Benchmarking Utility (sep_NE.exe). The article from Kaspersky “PlugX malware: A good hacker is an apologetic hacker” outlines a summary about it.

That’s it! With this article we set the table for the next article focusing on artifacts that might helps us uncover the hidden traits that were left behind by the attacker actions performed during this scenario. Stay tuned and have fun!


Tagged , , , ,

Digital Forensics – Artifacts of interactive sessions

In this article I would like to go over some of the digital forensic artifacts that are likely to be useful on your quest to find answers to investigative questions. Specially, when conducting digital forensics and incident response on security incidents that you know the attacker performed its actions while logged in interactively into a Microsoft Windows systems. Normally, one of the first things I look is the Windows Event logs. When properly configured they are a treasure trove of information, but in this article, I want to focus on artifacts that can be useful even if an attacker attempts to cover his tracks by deleting the Event Logs.

Let’s start with ShellBags!

To improve the customer experience, Microsoft operating systems stores folder settings in the registry. If you open a folder, resize its dimensions, close it and open it again, did you notice that Windows restored the view you had? Yep, that’s ShellBags in action. This information is stored in the user profile hive “NTUSER.dat” within the directory “C:\Users\%Username%\” and in the hive “UsrClass.dat” which is stored at “%LocalAppData%\Microsoft\Windows”. When a profile is loaded into the registry, both hives are mounted into the HKEY_USERS and then then linked to the root key HKEY_CURRENT_USER and HKEY_CURRENT_USER\Software\Classes respectively. If you are curious, you can see where the different files are loaded by looking at the registry key “HKEY_LOCAL_MACHINE\SYSTEM\CurrentControlSet\Control\hivelist”. On Windows XP and 2003 the ShellBags registry keys are stored at HKEY_USERS\{SID}\Software\​Microsoft\Windows\Shell\ and HKEY_USERS\{SID}\Software\​Microsoft\Windows\ShellNoRoam\.  On Windows 7 and beyond the ShellBags registry keys are stored at “HKEY_USERS\{SID}_Classes\​Local Settings\Software\​Microsoft\Windows\Shell\”.

Why are ShellBags relevant?

Well, this particular artifact allows us to get visibility about the intent or knowledge that a user or an attacker had when accessing or browsing directories and, when. Even if the directory does no longer exists. For example, an attacker that connects to a system using Remote Desktop and accesses a directory where his toolkit is stored. Or an unhappy employee that accesses a network share containing business data or intellectual property weeks before his last day and places this information on a USB drive. ShellBags artifacts can help us understand if such actions were performed. So, when you obtain the NTUSER.dat and UsrClass.dat hives you could parse it and then placed events into a timeline.  When corroborated with other artifacts, the incident response team can reconstruct user activities that were performed interactively and understand what happened and when.

Which tools can we use to parse ShellBags?

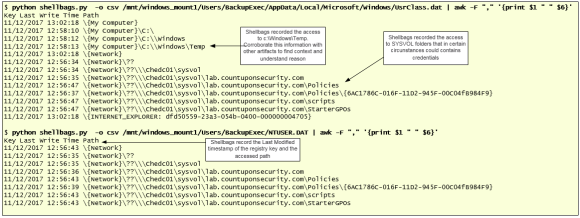
I like to use RegRipper from Harlan Carvey, ShellBags Explorer from Eric Zimmerman or Sbags from Willi Ballenthin. The below picture shows an example of using Willi’s tool to parse the ShellBags information from the NTUSER.dat and UsrClass.dat hives. As an example, this illustration shows that the attacker accessed several network folders within SYSVOL and also accessed “c:\Windows\Temp” folder.

To give you context, why I’m showing you this particular illustration of accessing the SYSVOL folder, is because they contain Active Directory Group Policy preference files that in some circumstances might contain valid domain credentials that can be easily decrypted. This is a known technique used by attackers to obtain credentials and likely to occur in the beginning of an incident. Searching for passwords in files such as these are simple ways for attackers to get credentials for service or administrative accounts without executing credential harvesting tools.

Next artifact on our list, JumpLists!

Once again, to increase the customer experience and accelerate the workflow, Microsoft introduced on Windows 7 the possibility to allow a user to access a list of recently used applications and files. This is done by enabling the feature to store and display recently opened programs and items in the Start Menu and the taskbar. There are two files that store JumpLists information. One is the {AppId}.automaticDestination-ms and the other is {AppId}.customDestination-ms where {AppId} corresponds to a 16 hex string that uniquely identifies the application and is calculated based on application path CRC64 with a few oddities. These files are stored in the folder “C:\Users\%USERNAME%\AppData\​Roaming\Microsoft\Windows\​Recent\AutomaticDestinations” and “C:\Users\%USERNAME%\AppData\​Roaming\Microsoft\Windows\​Recent\CustomDestinations”. The folder AutomaticDestinations contain files {16hexchars}.automaticDestination-ms and these files are generated by common operating system applications and stored in a in Shell Link Binary File Format known as [MS-SHLLINK] that are encapsulated Inside a Compound File Binary File Format known as MS-CFB or OLE. The folder CustomDestinations contain files {16hexchars}.customDestination-ms and these files are generated by applications installed by the user or scripts there were executed and stored in Shell Link Binary File Format known as [MS-SHLLINK].

Why are JumpLists relevant?

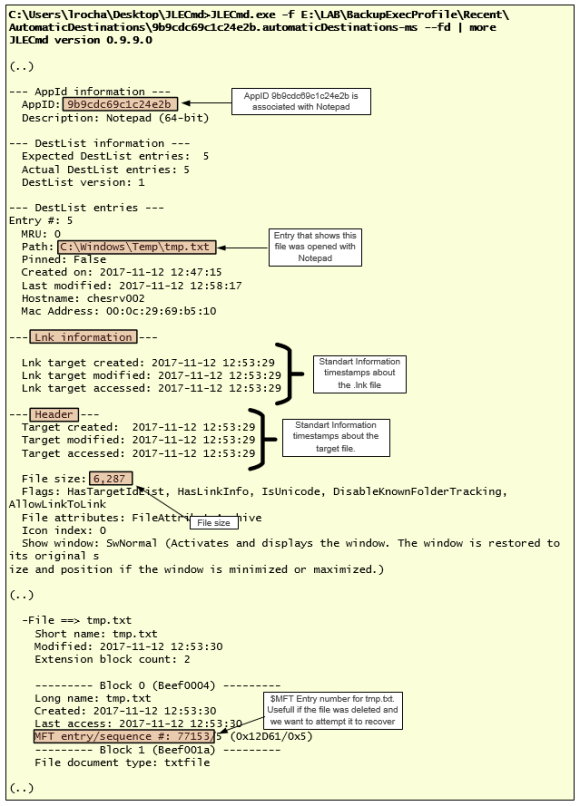
Just like like ShellBags, this artifact allows us to get visibility about the intent or knowledge an attacker had when opening a particular file, launching a particular application or browsing a specific directory during the course of an interactive session. For example, consider an attacker that is operating on a compromised system using Remote Desktop and launches a browser, the JumpList associated with it will contains the most visited or the recently closed website. If the attacker is pivoting between system using the Terminal Services client, the JumpList shows the system that was specified as an argument. If an attacker dumped credentials from memory and saved into a text file and opened it with Notepad, the JumpList will show evidence about it. Essentially, the metadata stored on these JumpList files can be parsed and will show you a chronological list of Most Recently Used (MRU) or Most Frequently Used (MFU) files opened by the user/application. Among other things, the information contains the Standard Information timestamps from the list entry and the time stamps from the file at the time of opening. Furthermore, it shows the original file path and sizes. This information, when placed into a timeline and corroborated with another artifact can give us a clear picture of the actions performed.

Which tools can we use to parse JumpLists?

JumpListsView from NIRSOFT, JumpLister from Mark Waon or JumpLists Explorer from Eric Zimmerman. Below an example of using Eric’s tool to parse the JumpLists files. More specifically the JumpList file that is associated with Notepad. As an example, this illustration shows that an attacker opened the file “C:\Windows\Temp\tmp.txt”with Notepad. It shows when the file was created and the MFT entry. Very useful.

Next artifact, LNK files!

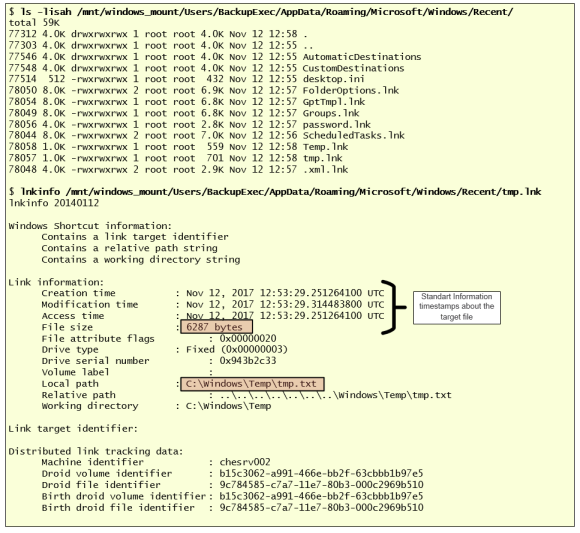
Again, consider an attacker operating on a compromised system using a Remote Desktop session where he dumped the credentials to a text file and then double clicked on the file. This action will result in the creation of the corresponding Windows shortcut file (LNK file). LNK files are Windows Shortcuts. Everyone that has used Windows has created a shortcut of your most favorite folder or program. However, the Windows operating system behind the scenes also keeps track of recently opened files by creating LNK files within the directory “C:\Documents and Settings\%USERNAME%\Recent\”.   The LNK files, like JumpLists, are stored in Shell Link Binary File Format known as [MS-SHLLINK]. When parsed, the LNK file, contains metadata that, among other things, shows the target file Standard Information timestamps, path, size and MFT entry number. This information is maintained even if the target file does no longer exists on the file system. The MFT entry number can be valuable in case the file was recently deleted and you would like to attempt to recover by carving it from the file system.

Which tools can we use to parse .LNK files?

Joachim Metz has an utility that to parse the information from the Windows Shortcut files. The utility is installed by default on SIFT workstation. In the illustration below, while analyzing a disk image, we could see that there are several .LNK files created under a particular profile. Knowing that this profile has been used by an attacker you could parse the files. In this case parsing, when parsing the file “tmp.lnk” file we can see the target file “C:\Windows\Temp\tmp.txt”, its size and when was created.

Next artifact, UserAssist!

The UserAssist registry key keeps track of the applications that were executed by a particular user. The data is encoded using ROT-13 substitution cipher and maintained on the registry key HKEY_USERS\{SID}\Software\​Microsoft\Windows\CurrentVersion​\Explorer\UserAssist.

Why is UserAssist relevant?

Consider an attacker operating on a compromised system where he launched “cmd.exe” to launch other Windows built-in commands, or opened the Active Directory Domains and Trusts Snap-in “domain.msc” to gather information about a particular domain, or launched a credential dumper from an odd directory. This action will be tracked by the UserAssist registry key. The registry key will show information about which programs have been executed by a specific user and how frequently. Due to the nature of how timestamps are maintained on registry ie., only the last modified timestamp is kept, this artifact will show when was the last time that a particular application was launched.

Which tools can we use to parse the UserAssist registry keys?

Once again RegRipper from Harlan Carvey is a great choice. Another tool is UserAssist from Didier Stevens. Other method that I often use is to use log2timeline using Windows Registry plugin and then grepping for the UserAssist parser. In this example, we can see that an attacker while operating under a compromised account, executed “cmd,exe”, “notepad.exe”and “mmc.exe”. Now combining these artifacts with the Shellbags, JumpLists and .LNK files, I can start to interpret the results.

Next artifact, RDP Bitmap Cache!

With the release of RDP 5.0 on Windows 2000, Microsoft introduced a persistent bitmap caching mechanism that augmented the bitmap RAM cache. With this mechanism, when you do a Remote Desktop connection, the bitmaps can get stored on disk and are available for the RDP client, allowing it to load them from disk instead of waiting on the latency of the network connection. Of course this was developed with low bandwidth network connections in mind. On Windows 7 and beyond the cache folder is located on “%USERPROFILE%\AppData\Local\Microsoft\Terminal Server Client\Cache\ ” and there two types of cache files. One that contains a .bmc extension and a newer format that was introduced on Windows 7 that follows the naming convention of “cache{4-digits}.bin’. Both files have tiles of 64×64 pixels. The .bmc files support different bits per pixel ranging from 8-bits to 32-bits. The .bin files are always 32-bits and have more capacity and a file can store up to 100Mb of data.

Why are RDP Bitmap cache files relevant?

If an attacker is pivoting between systems in a particular environment and is leveraging Remote Desktop then, on the system where the connection is initiated you could find the bitmap cache that was stored during the attacker Remote Desktop session. After reconstructing the bitmaps, that translate what was being visualized by the attacker, it might be possible to reconstruct the bitmap puzzle and observe what was seen by the attacker while performing the Remote Desktop connections to the compromised systems. A great exercise for people who like puzzles!

Which tools can we use to parse RDP Bitmap Cache files?

Unfortunately, there aren’t many tools available. ANSSI-FR released a RDP Bitmap Cache parser that you could use to extract the bitmaps from the cache files. There was a tool called BmcViewer that was available on a now defunct website and is great tool to parse the .bmc files. The tool doesn’t support the .bin files. If you know how to code, an interesting project might be to develop a parser that allows you to puzzle the tiles.

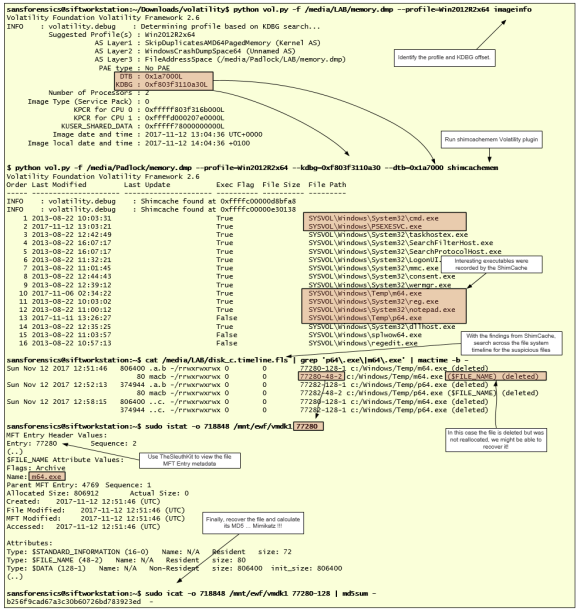
Finally, combining these artifacts with our traditional file system metadata timeline and other artifacts such as ShimCache, would allows us to further uncover more details. Below an illustration of parsing ShimCache from a memory image using Volatility and the ShimCacheMem plugin written by Fred House. We could see that there are some interesting files. For example “m64.exe” and looking at the adjacent entries we can see that it shows the execution of “notepad.exe”, “p64.exe” and “reg.exe”. Searching for those binaries on our file system timeline uncovers that for example m64.exe is Mimikatz.

That’s it for today! As I wrote in the beginning, the Windows Even Logs are a treasure trove of information when properly configured but If an attacker attempts to cover his tracks by deleting the Event Logs, there are many other artifacts to look for. Combine the artifacts outlined in this article with File system metadata, ShimCache, AMCache, RecentDocs, Browser History, Prefetch, WorldWheelQuery, ComDlg32, RunMRU, and many others and you likely will end up having a good understanding of what happened and when. Happy hunting!

References:
PS: Due to the extensive list of references I decided to attach a text file with links: references. Without them, this article won’t be possible.

Luttgens, J., Pepe, M., Mandia, K. (2014) Incident Response & Computer Forensics, 3rd Edition
Carvey, H. (2011) Windows Registry Forensics: Advanced Digital Forensic Analysis of the Windows Registry, Second Edition
SANS 508 – Advanced Computer Forensics and Incident Response

Tagged , , , , , , , ,

Analysis of a Master Boot Record – EternalPetya

NoPetya or EternalPetya has kept the security community pretty busy last week. A malware specimen that uses a combined arms approach and maximizes its capabilities by using different techniques to sabotage business operations. One aspect of the malware that raised my interest was the ability to overwrite the Master Boot Record (MBR) and launch a custom bootloader. This article shows my approach to extract the MBR using digital forensic techniques and then analyze the MBR using Bochs. Before we roll up our sleeves let’s do a quick review on how the MBR is used by today’s computers during the boot process.

The computers that rely on BIOS flash memory instead of the new EFI standard, when they boot, the BIOS code is executed and, among other things, the code performs a series of routines that perform hardware checks i.e., Power-On-Self-Tests (POST). Then, the BIOS attempts to find a bootable device. If the bootable device is a hard drive, the BIOS reads the sector 1, track 0, head 0 and if contains a valid MBR (valid means that the sector ends with bytes 0xAA55) it will load that sector into a fixed memory location. By convention the code will be loaded into the real-mode address 0000:7c00. Then, the instruction pointer register is transferred into that memory location and the CPU will start executing the MBR code. What happens next is dependable on the MBR implementation code i.e., different operating systems have different MBR code  Nonetheless, the code needs to fit in the 512-bytes available at disk sector. The MBR follows a standard and its structure contains executable code, the partition table (64-bytes) with the locations of the primary partitions and finally 2-bytes with 0xAA55 signature. This means only 446-bytes are available to implement a MBR. In the Microsoft world, when the MBR code is executed, its role is to find an active partition, read its first sector, which contains the VBR code, load it into memory and transfer execution into it. The VBR is a bootloader program that will find the Windows BootMgr program and executes it All this happens in 16-bits real-mode.

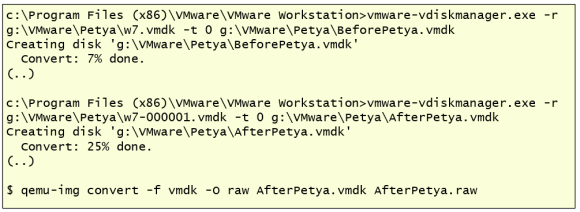
Now, that we have a brief overview about the boot process, how can we extract and analyze the MBR? More specifically the MBR that is used by EternalPetya? Well, we infect a victim machine on a controlled and isolated environment. We know that EternalPetya main component is a DLL and we can launch it and infect a Windows machine by running “rundll32.exe petya.dll, #1 10”. Our setup consisted of 2 Virtual Machines. One running with Windows 7 and another running REMnux. We created a snapshot of the victim machine before the infection. Then executed the malware. Following that, we waited 10 minutes for the infection to complete. The scheduled task created by the malware restarted the operating system and a ransom note appeared. Then, I shutdown the Windows 7 virtual machine and used vmware-vdiskmanager.exe utility to create a single VMDK file from the disk state before and after the infection. Next, I moved the VMDK files to a Linux machine where I used QEMU to convert the VMDK images to RAW format.

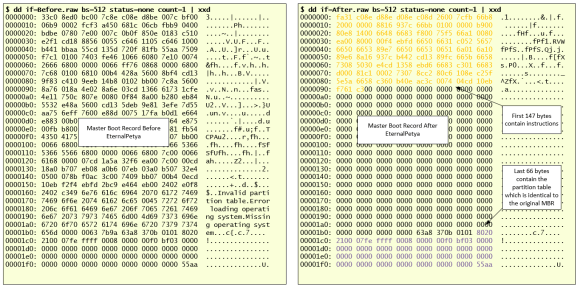
Following that I could start the analysis and look at the MBR differences. The picture below illustrates the difference between the original MBR and the EternalPetya MBR. On the right side you have the EternalPetya MBR, the first 147 bytes (0x00 through 0x92) contain executable code.  The last 66 bytes (0x1be through 0x1fd) contain the partition table and are equal to the original MBR.

So, we are interested in the code execution instructions. We can start by extracting the MBR into a binary file and convert it to assembly instructions. This can be done using radare, objdump or ndisasm. Now, this is the hard part of the analysis. Read the assembly instructions and understand what it does. We can look at the instructions and perform static analysis but we can also perform dynamic analysis by running the MBR code, combining both worlds we will have better understanding – or at least we can try.

To perform dynamic analysis of the MBR code we will use Bochs. Bochs is an open source, fully fledged x86 emulator. Originally written by Kevin Lawton in 1994 is still being actively maintained today and last April version 2.6.9 was released. Bochs brings a CLI and GUI debugger and is very useful to debug our MBR code.  In addition, Bochs can be integrated with IDA PRO and Radare.  You can download Bochs from here.  In our case, we want to use Bochs to dynamically debug our MBR code. For that we need a configuration file called Bochsrc which is used to specify different options such as the disk image and also the CHS parameters for the disk. This article from Hex-Rays contains a how-to on how to integrate Bochs with IDA PRO. At the end of the article there is the mbr_Bochs.zip file that you can download. We will use these files to use Bochs standalone or combined with IDA PRO in case you have it. The Bochsrc file that comes with the ZIP file contains options that are deprecated on the newer Bochs version. The picture below shows the Bochsrc options I used. The Bochs user guide documents this file well.
Then you can try your configuration setup and launch Bochs. If you have IDA PRO then you can use this guide starting from step 6 in order to integrate it with IDA PRO. If all is set up, the debugging session will open and stop at the first instruction from its own BIOS code at memory address F000:FFF0.  Why this address? You can read this and many other low level things in the outstanding work from Daniel B. Sedory.
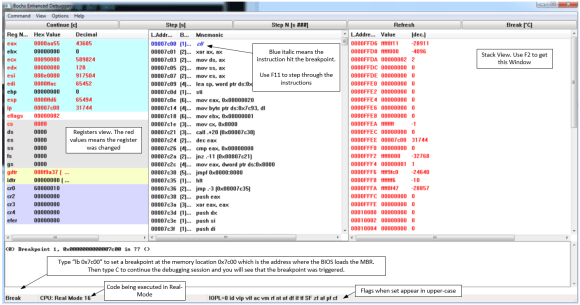
Uncomment the last line from the Bochsrc configuration file, to tell Bochs to use the Enhanced Debugger. For further references, you can read the “How to DEBUG System Code using The Bochs Emulator on a Windows™ PC” article. Start Bochs again and the GUI will show up. You can load the stack view by pressing F2. Then set a breakpoint where the MBR code will be loaded by issuing the command “lb 0x7c00” and then the “c” to continue the debugging session.

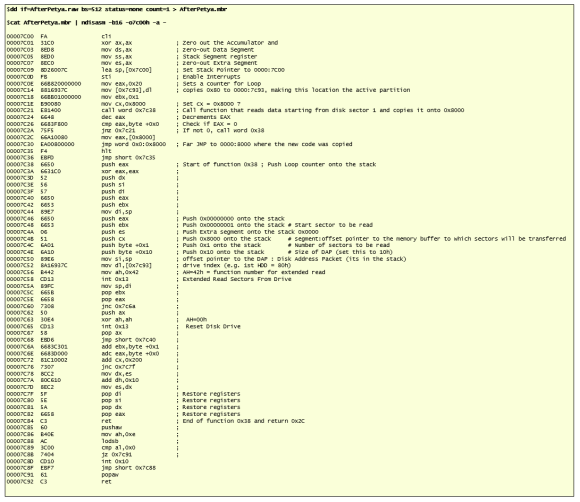
Now we can look at the code, step into the instructions, inspect the registers and stack. After some back and forth with the debugger I created the following listing with my interpretation of some of the instructions.

Bottom line, the MBR code will perform a loop that uses BIOS interrupt 0x13 function 0x42 to read data starting at sector 1 of the hard-drive. The loop copies 8880 (0x22af) bytes of data into memory location 0x8000. When the copy is done, the execution is transferred to the address 0x8000 by performing a far jump and the malicious bootloader is executed. The malicious bootloader code has been uploaded by Matthieu Suiche to Virus Total here. You can also extract it from the hard drive by extracting the sector 1 through 18 or better using the commands from the following picture. Then you can perform static and dynamic analysis.

The 16-bits bootloader code is harder to analyze than the MBR code but it is based on the Petya ransomware code from 2016. In this great article, from Hasherezade, she analyzes both Petya and EternalPetya bootloader using IDA PRO. When you use Bochs integrated with IDA PRO disassembler and debugger, the analysis is more accessible due to the powerful combination.

That’s it for today – Entering the world of real-mode execution on x86 is quite interesting. Analyzing code that relies on BIOS services such as software interrupts to perform different operations like reading from disk or writing to screen or, accessing the memory through segments is revealing. What we learned today might be a starting point to start looking at bootkits that are beneath the operating system and subvert the MBR boot sequence.

Have fun!

References:

Windows Internals, Sixth Edition, Part 2 By: Mark E. Russinovich, David A. Solomon, and Alex Ionescu

Various articles written by Daniel B. Sedory : http://starman.vertcomp.com/index.html

http://standa-note.blogspot.ch/2014/11/debugging-early-boot-stages-of-windows.html

Tagged , , ,

Threat Hunting in the Enterprise with AppCompatProcessor

Last April, at the SANS Threat Hunting and IR Summit, among other things, there was a new tool and technique released by Matias Bevilacqua. Matias’s presentation was titled “ShimCache and AmCache enterprise-wide hunting, evolving beyond grep” and he released the tool AppCompatProcessor. Matias also wrote a blog post “Evolving Analytics for Execution Trace Data” with more details.

In this article, I want to go over a quick exercise on how to use this tool and expand the existing signatures. First, let me write that, in case you have a security incident and you are doing enterprise incident response or you are performing threat hunting as part of your security operations duties, this is a fantastic tool that you should become familiar with and have on your toolkit. Why? Because it allows the security teams to digest, parse and analyze, at scale, two forensic artifacts that are very useful. The forensic artifacts are part of the Windows Application Experience and Compatibility features and are known as ShimCache and the AMCache.

To give you more context, the ShimCache can be obtained from the registry and from it we can obtain information about all executable binaries that have been executed in the system since it was rebooted. Furthermore, it tracks its size and the last modified date. In addition, the ShimCache tracks executables that have not been executed but were browsed for example through explorer.exe. This makes a valuable source of evidence for example to track executables that were on the system but weren’t executed – consider an attacker that used a directory on a system to move around his toolkit. The AMCache is stored on a file and from it we can retrieve information for every executable that run on the system such as the PATH, last modification time and created, SHA1 and PE properties. You can read more about those 2 artifacts in the article I wrote last year.

So, I won’t go over on how to acquire this data at scale – feel free to share you technique in the comments – but, AppCompatProcessor digests data that has been acquired by ShimCacheParser.py, Redline and MIR but also consumes raw ShimCache and AMCache registry hives. I will go directly to the features.At the time of this writing the tool version is 0.8 and one of the features I would like to focus today is the search module. This module allows us to search for known bad using regex expressions. The search module was coded with performance in mind, which means the regex searches are quite fast. By default, the tool includes more than 70 regex signatures for all kinds of interesting things an analyst will look for when perform threat hunting. Signatures include searching for dual usage tools like psexec , looking for binaries in places where they shouldn’t normally be, commonly named credential dumpers, etc. The great thing is that you can easily include your own signatures. Just add a regex line with your signature!

For this exercise, I want to use the search module to search for binaries that are commonly used by the PlugX backdoor family and friends. This backdoor is commonly used by different threat groups on targeted attacks. PlugX is also refered as KORPLUG, SOGU, DestroyRAT and is a modular backdoor that is designed to rely on the execution of signed and legitimated executables to load malicious code. PlugX, normally has three main components, a DLL, an encrypted binary file and a legitimated executable that is used to load the malware using a technique known as DLL search order. I won’t go discuss the details about PlugX in this article but you can read the White Paper “PlugX – Payload Extraction” done by Kevin O’Reilly from Context, the presentation about Plugx at Black Hat ASIA in 2014 given by Takahiro Haruyama and Hiroshi Suzuki, the analysis done by the Computer Incident Response Center Luxembourg and the Ahnlab threat report. With this and other reports you could start compiling information about different PlugX payloads. However, Adam Blaszczyk from Hexacorn, already did that job and wrote an article where he outlines different PlugX payloads seen in the wild.

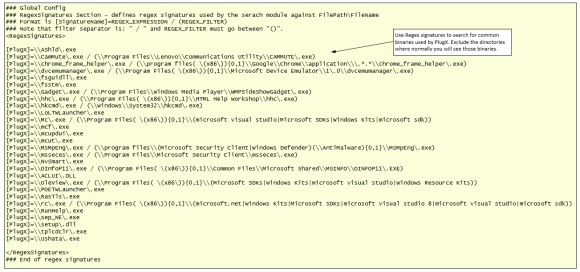
Ok, with this information, we start creating the PlugX regex signatures. Essentially we will be looking for the signed and legitimate executables but in places where they won’t normaly be. The syntax to create a new regex signature is simple and you can add your own signatures to the existing AppCompatSearch.txt file or just create a new file called AppCompatSearch-PlugX.txt which will be consumed automatically by the tool. The figure below shows the different signatures that I produced. . At the time of this writing, this is still work in progress but is a starting point.

Next step, launch AppCompatProcessor against our data set using the newly created signatures. The following picture shows how the output of the search module looks like. In this particular case the search produced 25 hits and a nicely presented summary of the hits is displayed on a histogram. The raw dumps of the hits are saved on the file called Output.txt.  As an analyst or investigator, you would look at the results and verify which ones would be worth to further investigate and which ones are false positives. For this exercise, there was a hit that triggered on the file “c:\Temp\MsMpEng.exe”. This file is part of the Windows Defender suite but could be used by PlugX as part of DLL search order hijack technique. Basically, the attacker will craft a malicious DLL named MpSvc.dll and will place that in the same directory as the MsMpEng.exe file and execute MsMpEng.exe. The DLL would need to be crafted in a special way but that is what PlugX specializes in. This will load the attacker code.

Following these findings, we would want to look at the system that triggered the signature and view all the entries. The picture below shows this step where we use the dump module. The output shows all the ShimCache entries for this particular system. The entries are normally sorted in order of execution from bottom to top, and in this case, adjacent to the “c:\Temp\MsMpEng.exe” file there are several windows built-in commands that were executed and a file named “c:\Temp\m64.exe”. This is what Matias calls a strong temporal execution correlation. This is indicative that an attacker obtained access to the system, executed several windows built-in commands and and executed a file called “m64.exe” which likely is Mimikatz or a cousin. 

Following those leads, you might want to obtain those binaries from the system and perform malware analysis in order to extract indicators of compromise such as the C&C address, look at other artifacts such Windows Event Logs, UsnJournal, memory, etc.. and have additional leads. In addition, you might want to further use AppCompatProcessor to search for the “m64.exe” file and also use the tstack module, to search across all the data set for binaries that match the date of those two binaries. With these findings, among other things, you would need to scope the incident by understanding which systems the attacker accessed, find new investigation leads and pivot on the findings. AppCompatProcessor is a tool that helps doing that. This kind of finding would definitely trigger your incident response processes and procedures.

That’s it, hopefully, AppCompatProcessor will reduce the entry barrier for your security operations center or incident response teams to start performing threat hunting in your environment and produce actionable results. If you find this useful, contribute with your threat hunting signatures in AppCompatProcessor GitHub repo and Happy Hunting!


Tagged , , , , , ,