Tag Archives: Digital Forensics

Digital Forensics – Artifacts of interactive sessions

In this article I would like to go over some of the digital forensic artifacts that are likely to be useful on your quest to find answers to investigative questions. Specially, when conducting digital forensics and incident response on security incidents that you know the attacker performed its actions while logged in interactively into a Microsoft Windows systems. Normally, one of the first things I look is the Windows Event logs. When properly configured they are a treasure trove of information, but in this article, I want to focus on artifacts that can be useful even if an attacker attempts to cover his tracks by deleting the Event Logs.

Let’s start with ShellBags!

To improve the customer experience, Microsoft operating systems stores folder settings in the registry. If you open a folder, resize its dimensions, close it and open it again, did you notice that Windows restored the view you had? Yep, that’s ShellBags in action. This information is stored in the user profile hive “NTUSER.dat” within the directory “C:\Users\%Username%\” and in the hive “UsrClass.dat” which is stored at “%LocalAppData%\Microsoft\Windows”. When a profile is loaded into the registry, both hives are mounted into the HKEY_USERS and then then linked to the root key HKEY_CURRENT_USER and HKEY_CURRENT_USER\Software\Classes respectively. If you are curious, you can see where the different files are loaded by looking at the registry key “HKEY_LOCAL_MACHINE\SYSTEM\CurrentControlSet\Control\hivelist”. On Windows XP and 2003 the ShellBags registry keys are stored at HKEY_USERS\{SID}\Software\​Microsoft\Windows\Shell\ and HKEY_USERS\{SID}\Software\​Microsoft\Windows\ShellNoRoam\.  On Windows 7 and beyond the ShellBags registry keys are stored at “HKEY_USERS\{SID}_Classes\​Local Settings\Software\​Microsoft\Windows\Shell\”.

Why are ShellBags relevant?

Well, this particular artifact allows us to get visibility about the intent or knowledge that a user or an attacker had when accessing or browsing directories and, when. Even if the directory does no longer exists. For example, an attacker that connects to a system using Remote Desktop and accesses a directory where his toolkit is stored. Or an unhappy employee that accesses a network share containing business data or intellectual property weeks before his last day and places this information on a USB drive. ShellBags artifacts can help us understand if such actions were performed. So, when you obtain the NTUSER.dat and UsrClass.dat hives you could parse it and then placed events into a timeline.  When corroborated with other artifacts, the incident response team can reconstruct user activities that were performed interactively and understand what happened and when.

Which tools can we use to parse ShellBags?

I like to use RegRipper from Harlan Carvey, ShellBags Explorer from Eric Zimmerman or Sbags from Willi Ballenthin. The below picture shows an example of using Willi’s tool to parse the ShellBags information from the NTUSER.dat and UsrClass.dat hives. As an example, this illustration shows that the attacker accessed several network folders within SYSVOL and also accessed “c:\Windows\Temp” folder.

To give you context, why I’m showing you this particular illustration of accessing the SYSVOL folder, is because they contain Active Directory Group Policy preference files that in some circumstances might contain valid domain credentials that can be easily decrypted. This is a known technique used by attackers to obtain credentials and likely to occur in the beginning of an incident. Searching for passwords in files such as these are simple ways for attackers to get credentials for service or administrative accounts without executing credential harvesting tools.

Next artifact on our list, JumpLists!

Once again, to increase the customer experience and accelerate the workflow, Microsoft introduced on Windows 7 the possibility to allow a user to access a list of recently used applications and files. This is done by enabling the feature to store and display recently opened programs and items in the Start Menu and the taskbar. There are two files that store JumpLists information. One is the {AppId}.automaticDestination-ms and the other is {AppId}.customDestination-ms where {AppId} corresponds to a 16 hex string that uniquely identifies the application and is calculated based on application path CRC64 with a few oddities. These files are stored in the folder “C:\Users\%USERNAME%\AppData\​Roaming\Microsoft\Windows\​Recent\AutomaticDestinations” and “C:\Users\%USERNAME%\AppData\​Roaming\Microsoft\Windows\​Recent\CustomDestinations”. The folder AutomaticDestinations contain files {16hexchars}.automaticDestination-ms and these files are generated by common operating system applications and stored in a in Shell Link Binary File Format known as [MS-SHLLINK] that are encapsulated Inside a Compound File Binary File Format known as MS-CFB or OLE. The folder CustomDestinations contain files {16hexchars}.customDestination-ms and these files are generated by applications installed by the user or scripts there were executed and stored in Shell Link Binary File Format known as [MS-SHLLINK].

Why are JumpLists relevant?

Just like like ShellBags, this artifact allows us to get visibility about the intent or knowledge an attacker had when opening a particular file, launching a particular application or browsing a specific directory during the course of an interactive session. For example, consider an attacker that is operating on a compromised system using Remote Desktop and launches a browser, the JumpList associated with it will contains the most visited or the recently closed website. If the attacker is pivoting between system using the Terminal Services client, the JumpList shows the system that was specified as an argument. If an attacker dumped credentials from memory and saved into a text file and opened it with Notepad, the JumpList will show evidence about it. Essentially, the metadata stored on these JumpList files can be parsed and will show you a chronological list of Most Recently Used (MRU) or Most Frequently Used (MFU) files opened by the user/application. Among other things, the information contains the Standard Information timestamps from the list entry and the time stamps from the file at the time of opening. Furthermore, it shows the original file path and sizes. This information, when placed into a timeline and corroborated with another artifact can give us a clear picture of the actions performed.

Which tools can we use to parse JumpLists?

JumpListsView from NIRSOFT, JumpLister from Mark Waon or JumpLists Explorer from Eric Zimmerman. Below an example of using Eric’s tool to parse the JumpLists files. More specifically the JumpList file that is associated with Notepad. As an example, this illustration shows that an attacker opened the file “C:\Windows\Temp\tmp.txt”with Notepad. It shows when the file was created and the MFT entry. Very useful.

Next artifact, LNK files!

Again, consider an attacker operating on a compromised system using a Remote Desktop session where he dumped the credentials to a text file and then double clicked on the file. This action will result in the creation of the corresponding Windows shortcut file (LNK file). LNK files are Windows Shortcuts. Everyone that has used Windows has created a shortcut of your most favorite folder or program. However, the Windows operating system behind the scenes also keeps track of recently opened files by creating LNK files within the directory “C:\Documents and Settings\%USERNAME%\Recent\”.   The LNK files, like JumpLists, are stored in Shell Link Binary File Format known as [MS-SHLLINK]. When parsed, the LNK file, contains metadata that, among other things, shows the target file Standard Information timestamps, path, size and MFT entry number. This information is maintained even if the target file does no longer exists on the file system. The MFT entry number can be valuable in case the file was recently deleted and you would like to attempt to recover by carving it from the file system.

Which tools can we use to parse .LNK files?

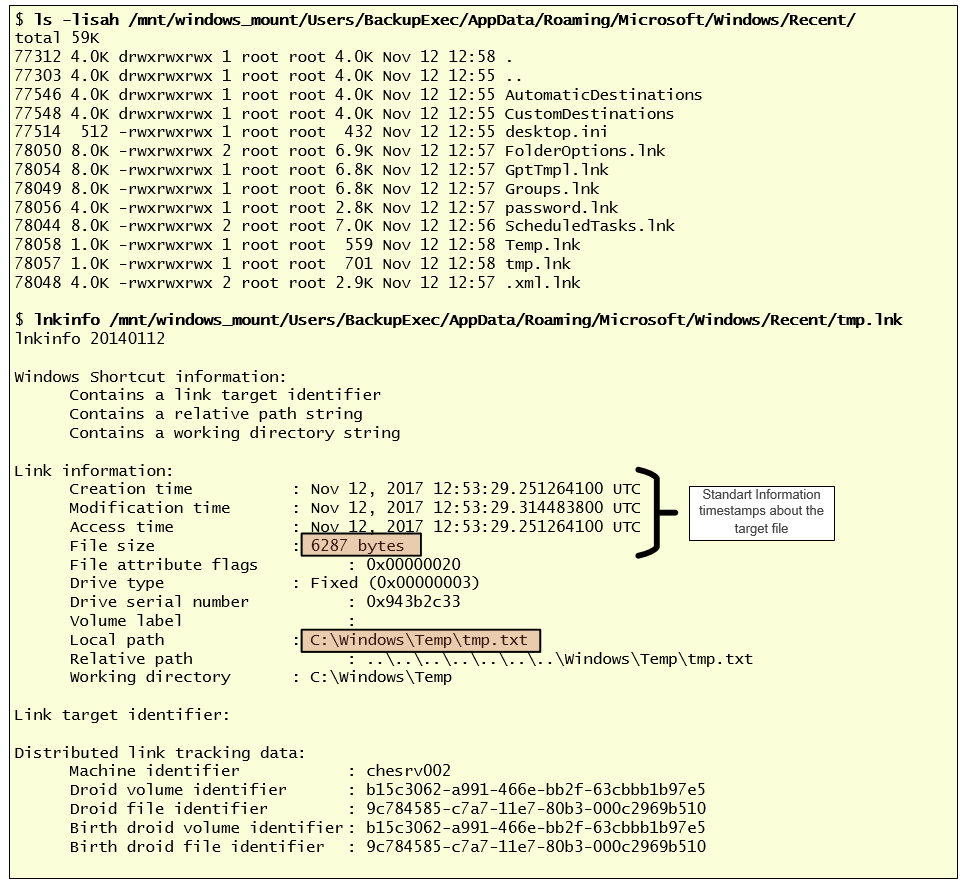
Joachim Metz has an utility that to parse the information from the Windows Shortcut files. The utility is installed by default on SIFT workstation. In the illustration below, while analyzing a disk image, we could see that there are several .LNK files created under a particular profile. Knowing that this profile has been used by an attacker you could parse the files. In this case parsing, when parsing the file “tmp.lnk” file we can see the target file “C:\Windows\Temp\tmp.txt”, its size and when was created.

Next artifact, UserAssist!

The UserAssist registry key keeps track of the applications that were executed by a particular user. The data is encoded using ROT-13 substitution cipher and maintained on the registry key HKEY_USERS\{SID}\Software\​Microsoft\Windows\CurrentVersion​\Explorer\UserAssist.

Why is UserAssist relevant?

Consider an attacker operating on a compromised system where he launched “cmd.exe” to launch other Windows built-in commands, or opened the Active Directory Domains and Trusts Snap-in “domain.msc” to gather information about a particular domain, or launched a credential dumper from an odd directory. This action will be tracked by the UserAssist registry key. The registry key will show information about which programs have been executed by a specific user and how frequently. Due to the nature of how timestamps are maintained on registry ie., only the last modified timestamp is kept, this artifact will show when was the last time that a particular application was launched.

Which tools can we use to parse the UserAssist registry keys?

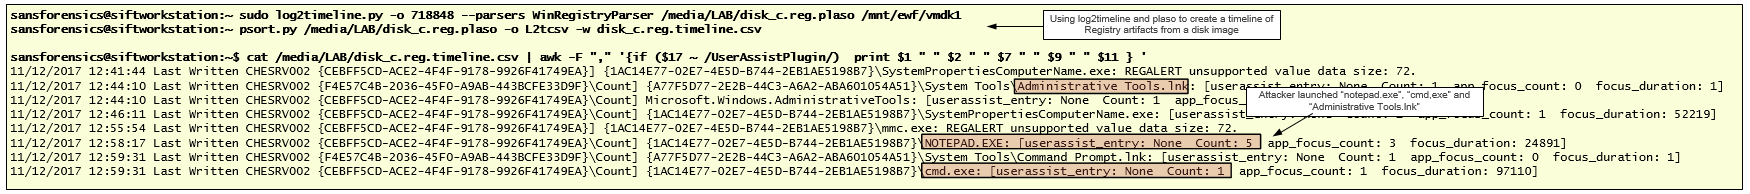
Once again RegRipper from Harlan Carvey is a great choice. Another tool is UserAssist from Didier Stevens. Other method that I often use is to use log2timeline using Windows Registry plugin and then grepping for the UserAssist parser. In this example, we can see that an attacker while operating under a compromised account, executed “cmd,exe”, “notepad.exe”and “mmc.exe”. Now combining these artifacts with the Shellbags, JumpLists and .LNK files, I can start to interpret the results.

Next artifact, RDP Bitmap Cache!

With the release of RDP 5.0 on Windows 2000, Microsoft introduced a persistent bitmap caching mechanism that augmented the bitmap RAM cache. With this mechanism, when you do a Remote Desktop connection, the bitmaps can get stored on disk and are available for the RDP client, allowing it to load them from disk instead of waiting on the latency of the network connection. Of course this was developed with low bandwidth network connections in mind. On Windows 7 and beyond the cache folder is located on “%USERPROFILE%\AppData\Local\Microsoft\Terminal Server Client\Cache\ ” and there two types of cache files. One that contains a .bmc extension and a newer format that was introduced on Windows 7 that follows the naming convention of “cache{4-digits}.bin’. Both files have tiles of 64×64 pixels. The .bmc files support different bits per pixel ranging from 8-bits to 32-bits. The .bin files are always 32-bits and have more capacity and a file can store up to 100Mb of data.

Why are RDP Bitmap cache files relevant?

If an attacker is pivoting between systems in a particular environment and is leveraging Remote Desktop then, on the system where the connection is initiated you could find the bitmap cache that was stored during the attacker Remote Desktop session. After reconstructing the bitmaps, that translate what was being visualized by the attacker, it might be possible to reconstruct the bitmap puzzle and observe what was seen by the attacker while performing the Remote Desktop connections to the compromised systems. A great exercise for people who like puzzles!

Which tools can we use to parse RDP Bitmap Cache files?

Unfortunately, there aren’t many tools available. ANSSI-FR released a RDP Bitmap Cache parser that you could use to extract the bitmaps from the cache files. There was a tool called BmcViewer that was available on a now defunct website and is great tool to parse the .bmc files. The tool doesn’t support the .bin files. If you know how to code, an interesting project might be to develop a parser that allows you to puzzle the tiles.

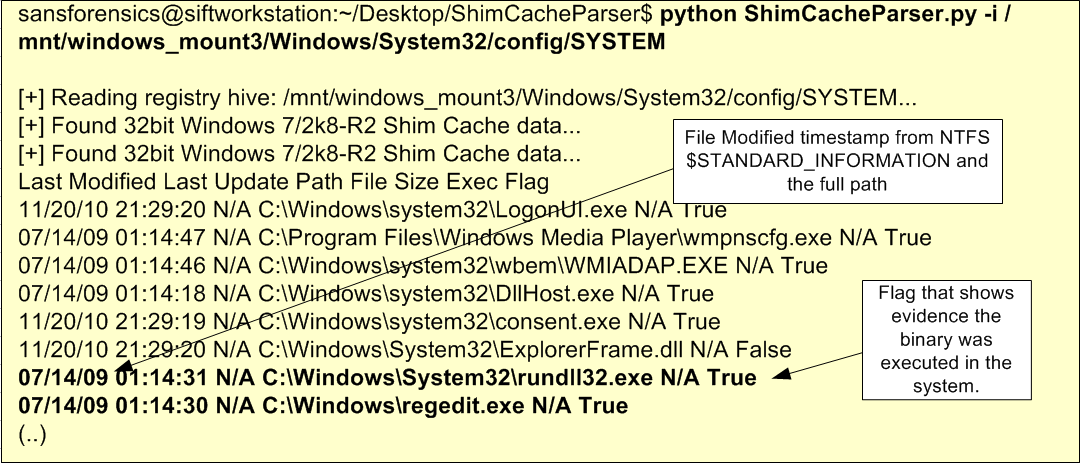
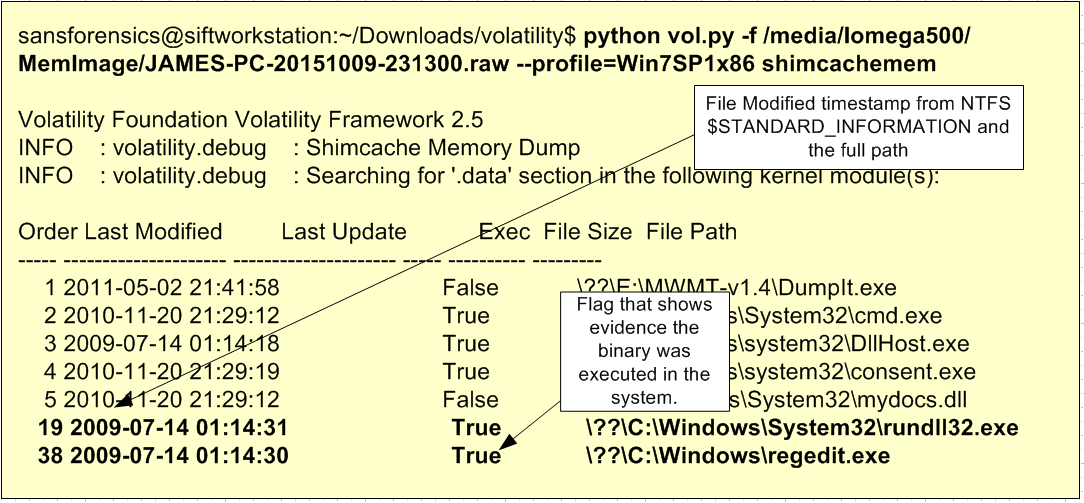
Finally, combining these artifacts with our traditional file system metadata timeline and other artifacts such as ShimCache, would allows us to further uncover more details. Below an illustration of parsing ShimCache from a memory image using Volatility and the ShimCacheMem plugin written by Fred House. We could see that there are some interesting files. For example “m64.exe” and looking at the adjacent entries we can see that it shows the execution of “notepad.exe”, “p64.exe” and “reg.exe”. Searching for those binaries on our file system timeline uncovers that for example m64.exe is Mimikatz.

That’s it for today! As I wrote in the beginning, the Windows Even Logs are a treasure trove of information when properly configured but If an attacker attempts to cover his tracks by deleting the Event Logs, there are many other artifacts to look for. Combine the artifacts outlined in this article with File system metadata, ShimCache, AMCache, RecentDocs, Browser History, Prefetch, WorldWheelQuery, ComDlg32, RunMRU, and many others and you likely will end up having a good understanding of what happened and when. Happy hunting!

References:
PS: Due to the extensive list of references I decided to attach a text file with links: references. Without them, this article won’t be possible.

Luttgens, J., Pepe, M., Mandia, K. (2014) Incident Response & Computer Forensics, 3rd Edition
Carvey, H. (2011) Windows Registry Forensics: Advanced Digital Forensic Analysis of the Windows Registry, Second Edition
SANS 508 – Advanced Computer Forensics and Incident Response

Tagged , , , , , , , ,

Digital Forensics – DLL Search Order

Following our series of posts on Digital Forensics we will continue our journey about analyzing our compromised system. In the last two articles we covered Windows Prefetch and Shimcache. Among other things, we wrote that Windows Prefetch and ShimCache artifacts are useful to find evidence about executed files and executables that were on the system but weren’t execute. While doing our investigation and looking at these artifacts, the Event Logs and the SuperTimeline, we found evidence that REGEDIT.EXE was executed. In addition, from the Prefetch artifacts we saw this execution invoked a DLL called CLB.DLL from the wrong path. On Windows operating systems CLB.DLL is located under %SYSTEMROOT%\System32.  In this case CLB.DLL was invoked from %SYSTEMROOT%.

However, when we looked inside the %SYSTEMROOT% folder and we could not find any traces of the CLB.DLL file. This raised the following questions:

  • How did this file got loaded from the wrong PATH?
  • Did file got deleted by the attacker?

Let’s answer the first question.

Inside PE files there is a structure called Import Address Table (IAT) that contains the addresses of the library routines that are imported from DLL’s. When an application is launched the operating system will check this table to understand which routines are needed and from which DLL’s. For example, when I execute REGEDIT.EXE the binary has a set of dependencies needed in order to execute.  To see this dependencies, you can look at the IAT. On Windows you could use dumpbin.exe /IMPORTS or on REMNUX you could use pedump as illustrated below.

dllsearchorder-regiat

But from where will this DLL’s be loaded from? The operating system will locate the required DLL’s by searching a specific set of directories in a particular order. This is known as the DLL Search Order and is explained here. This mechanism can and has been abused frequently by attackers to plant a malicious DLL inside a directory that is part of the DLL Search Order mechanism. This will trick the Windows operating system to load the malicious DLL instead of the real one.  The DLL Search Order by default on Windows XP and above is the following:

  • The directory from which the application loaded.
  • The current directory.
  • The system directory.
  • The 16-bit system directory.
  • The Windows directory.
  • The directories that are listed in the PATH environment variable.

Not all DLL’s will be found using the DLL Search Order. There is a mechanism known as KnownDLLs Registry Key which contains a list of important DLL’s that will be invoked without consulting the DLL Search Order. This key is stored in the registry location HKEY_LOCAL_MACHINE\System\CurrentControlSet\Control\Session Manager\KnownDLLs.

Throughout the years Microsoft patched some of the problems with DLL Search Order mechanism and also introduced some improvements. One is the Safe DLL Search Order Registry which changes the order and moves the search of “The Current Directory” to the bottom making harder for the attacker without admin rights to plant a DLL in a place that will be searched first. This feature is controlled by the registry key HKEY_LOCAL_MACHINE\System\CurrentControlSet\Control\Session Manager\SafeDllSearchMode.

Bottom-line, this technique is known as DLL pre-loading, side-loading or hijacking and is an attack vector used to takeover a DLL and escalate privileges or achieve persistence by taking advantage of the way DLL’s are searched. This technique can be pulled off by launching an executable that is not in %SYSTEMROOT%\System32 – like our REGEDIT.EXE – or by leveraging weak Directory Access Control Lists (DACLS) and dropping a malicious DLL in the appropriate folder. In addition, for this technique to work the malicious DLL should contain the same exported functions and functionality has the hijacked DLL or work as proxy in order to ensure the executed program will run properly.  The picture below shows the routines that are exported by the malicious DLL. As you could see these are the same functions like the ones required by REGEDIT.EXE from the CLB.DLL.

dllsearchorder-iat

To further understand the details, you might want to read a write-up on leveraging this technique to escalate privileges described by Parvez Anwar here and to achieve persistence described by Nick Harbour here. Microsoft also gives guidance to developers on how to make applications more resistant to this attacks here.

Considering the REGEDIT.EXE example we can see from where the DLL’s are loaded on a pristine system using Microsoft Windows debugger like CDB.EXE.  Here we can see that CLB.DLL is loaded from %SYSTEMROOT%\System32.

dllsearchorder-regedit

We have now a understanding about how that DLL file might have been loaded. DLL sideloading is a clever technique that load malicious code and is often used and abused to either escalate privileges or to achieve persistence. We found evidences of it using the Prefetch artifacts but without Prefetch e.g., a Windows Server, this won’t be so easy to find and we might need to rely on other sources of evidence like we saw on previous articles. Based on the evidence we observed we consider that the attacker used DLL sideloading technique to hijack CLB.DLL and execute malicious code when invoking REGEDIT.EXE. However, we could not find this DLL file on our system. We will need to look deeper and use different tools and techniques that help us find evidence about it and answer the question we raised in the begging. This will be the topic of the upcoming article!


References:
Luttgens, J., Pepe, M., Mandia, K. (2014) Incident Response & Computer Forensics, 3rd Edition
Carvey, H. (2014) Windows Forensic Analysis Toolkit, 4th Edition
Russinovich, M. E., Solomon, D. A., & Ionescu, A. (2012). Windows internals: Part 1
Russinovich, M. E., Solomon, D. A., & Ionescu, A. (2012). Windows internals: Part 2

Tagged , , ,

Digital Forensics – ShimCache Artifacts

shimcacheFollowing our last article about the Prefetch artifacts we will now move into the Windows Registry. When conducting incident response and digital forensics on Windows operating systems one of the sources of evidence that is normally part of every investigation is the Windows Registry.  The Windows Registry is an important component of the OS and applications functionality, maintains many aspects of its configuration and plays a key role on its performance. As written by Jerry Honeycutt on his books the Windows Registry is the heart and soul of modern Windows operating systems. The Windows Registry is a topic for a book on its own, either from a systems or a forensics perspective. One great example is the book “Windows Registry Forensics 2nd Edition“ from Harlan Carvey.

In any case, from a forensics perspective, the Windows registry is a treasure trove of valuable artifacts. Among these artifacts you might be looking at System and Configuration Registry Keys, Common Auto-Run Registry Keys, User Hive Registry keys or the Application Compatibility Cache a.k.a. ShimCache.

In this article we will look into the Application Compatibility Cache a.k.a. ShimCache. When performing Live Response or dead box forensics on Windows operating systems one of the many artifacts that might be of interest when determining which files have been executed and were accessed is the ShimCache. In our last article we mentioned the Prefetch where you could get evidence about a specific file being executed on the system. However, on Windows Servers operating systems, the Prefetch is disabled by default. This means the ShimCache is a great alternative and also a valuable source of evidence.

Let’s start with some background about the ShimCache. Microsoft introduced the ShimCache in Windows 95 and it remains today a mechanism to ensure backward compatibility of older binaries into new versions of Microsoft operating systems. When new Microsoft operating systems are released some old and legacy application might break. To fix this Microsoft has the ShimCache which acts as a proxy layer between the old application and the new operating system. A good overview about what is the ShimCache is available on the Microsoft Blog on an article written by Tim Newton “Demystifying Shims – or – Using the App Compat Toolkit to make your old stuff work with your new stuff“.

The interesting part is that from a forensics perspective the ShimCache is valuable because the cache tracks metadata for binary that was executed and stores it in the ShimCache.  Nevertheless, it wasn’t until 2012 when Andrew Davis wrote ” Leveraging the Application Compatibility Cache in Forensic Investigations” and released the ShimCache Parser tool that the value of this evidence source came widely known. This was a novel paper because Andrew made available a tool that could extract from the registry information about the ShimCache that is valuable for an investigation.  The paper outlines the internals of the ShimCache and where the data resides on the different Windows operating systems.

On Windows XP this data structure is stored under the registry key HKLM\CurrentControlSet\Control\Session Manager\AppCompatibility\AppCompatCache. On recent Windows the ShimCache data is stored under the registry key  HKLM\SYSTEM\CurrentControlSet\Control\Session Manager\AppCompatCache\AppCompatCache

In the ShimCache we can obtain information about all executed binaries that have been executed in the system since it was rebooted and it tracks its size and the last modified date. In addition the ShimCache tracks executables that have not been executed but were browsed for example through explorer.exe. This makes a valuable source of evidence for example to track executables that were on the system but weren’t executed – consider an attacker that used a directory on a system to move around his toolkit.

On Windows XP the ShimCache maints up to 96 entries but on Windows 7 and earlier the ShimCache can maintain up to 1024 entries. Using the ShimCache Parser we can parse and view its contents. We only need to point to the SYSTEM registry hive file on our mounted evidence as illustrated below.

shimcache-parser

Nonetheless, the ShimCache as one drawback. The information is retained in memory and is only written to the registry when the system is shutdown. This impacts the ability of getting this source of evidence when conducting live response. To address this limitation Fred House, Claudiu Teodorescu, Andrew Davis wrote a Volatility plugin to read the ShimCache from memory. The plugin supports Windows XP SP2 through Windows 2012 R2 on both 32 and 64 bit architectures. This plugin won the volatility plugin contest of 2015. A write-up about it is available here and here. The plugin can be downloaded from the Volatility Community plugins page.  The picture below illustrates the usage of Volatility with the ShimCacheMem plugin against the memory of the analyzed system.

shimcache-volatility

By looking at the ShimCache either directly from memory or by querying the registry after system shutdown we can – in this case – confirm the evidence found in the Prefetch artifacts. On a Windows Server system because by default the Prefetch is disabled the ShimCache becomes a more valuable artifact.

Given the availability of this artifact across all Windows operating systems, the information obtained from the ShimCache can be valuable to an investigation. In this case, the ShimCache supported the findings of Prefetch on regedit.exe and rundll32.exe being executed on the system.

There are more artifacts associated with this feature. In 2013, Corey Harrell wrote on his blog his findings about the Windows 7 RecentFileCache.bcf file. Essentially, this file is maintained in %SYSTEMROOT%\AppCompat\Programs\ directory and keeps metadata (PATH and filename) about executable that are new in the system since the last time the service Application Experience was run. Yogesh Khatri, continued to research Corey findings and found that on Windows 8 this file has been replaced with a registry HIVE called amcache.hve which contains more metadata. From this file you can retrieve for every executable that run on the system the PATH, last modification time & created,  SHA1 and PE properties. Meanwhile, Yogesh noted that on Windows 7 you could also have the amcache.hve if you have installed KB2952664. To read the amcache HIVE you could use RegRipper or Willi Ballenthin stand-alone script.

The ShimCache has not only been used from a defensive perspective. From a offensive perspective, the ShimCache has been used several times by attacker. One of the best resources I’ve come across about the ShimCache is the website “sdb.tools” created by Sean Pierce dedicated to Application Compatibility database research and where he maintains his research and lists different tools, papers and talks.

That’s it, we went over a brief explanation on what is ShimCache, its artifacts, where to find it in memory and in the registry and which tools to use to obtain information from it. Next, we will go back to our SuperTimeline and continue our investigation.


References:
Luttgens, J., Pepe, M., Mandia, K. (2014) Incident Response & Computer Forensics, 3rd Edition
SANS 508 – Advanced Computer Forensics and Incident Response

Tagged , , , , ,

Computer Forensics and Investigation Methodology – 8 steps

sans-siftAccepted methods and procedures to properly seize, safeguard, analyze data and determine what happen. Actionable information to deal with computer forensic cases. Repeatable and effective steps. It’s a good way to describe the SANS methodology for IT Forensic investigations compelled by Rob Lee and many others. It is an 8 steps methodology. It will help the investigator to stay on track and assure proper presentation of computer evidence for criminal or civil case into court, legal proceedings and internal disciplinary actions, handling of malware incidents and unusual operational problems. Furthermore, is a good starting point in order to have a reasonable knowledge of forensic principles, guidelines, procedures, tools and techniques.

The purpose of these 8 steps is to respond systematically to forensic investigations and determine what happen. A similar process exists and was created by NIST on the Guide to Integrating Forensic Techniques into Incident Response  (pub. #: 800-86) published in 2006. This special publication is consistent with SANS methodology and reflect the same basic principles, differing on the granularity of each phase or terms used. Other similar methodologies are described in the ISO-27041.

Also is important to consider that a computer forensic investigation goes hand in hand with computer incident handling and is normally a break-off point of the containment phase.

Below a short and high level introduction of the 8 Computer Forensic Investigation steps:

Verification: Normally the computer forensics investigation will be done as part of an incident response scenario, as such the first step should be to verify that an incident has taken place. Determine the breadth and scope of the incident, assess the case. What is the situation, the nature of the case and its specifics. This preliminary step is important because will help determining the characteristics of the incident and defining the best approach to identify, preserve and collect evidence. It might also help justify to business owners to take a system offline.

System Description: Then it follows the step where you start gathering data about the specific incident. Starting by taking notes and describing the system you are going to analyze, where is the system being acquired, what is the system role in the organization and in the network. Outline the operating system and its general configuration such as disk format, amount of RAM and the location of the evidence.

Evidence Acquisition: Identify possible sources of data, acquire volatile and non-volatile data, verify the integrity of the data and ensure chain of custody. When in doubt of what to collect be on the safe side and is better to rather collect too much than not. During this step is also important that you prioritize your evidence collection and engage the business owners to determine the execution and business impact of chosen strategies. Because volatile data changes over time, the order in which data is collected is important. One suggested order in which volatile data should be acquired is network connections, ARP cache, login sessions, running processes, open files and the contents of RAM and other pertinent data – please note that all this data should be collected using trusted binaries and not the ones from the impacted system. After collecting this volatile data you go into the next step of collecting non-volatile data such as the hard drive. To gather data from the hard drive depending on the case there are normally three strategies to do a bit stream image: using a hardware device like a write blocker in case you can take the system offline and remove the hard drive ; using an incident response and forensic toolkit such as Helix that will be used to boot the system ; using live system acquisition (locally or remotely) that might be used when dealing with encrypted systems or systems that cannot be taken offline or only accessible remotely.  After acquiring data, ensure and verify its integrity. You should also be able to clearly describe how the evidence was found, how it was handled and everything that happened to it i.e. chain of custody.

Note that as part of your investigation and analysis the following steps work in a loop where you can jump from one into another in order to find footprints and tracks left by Evil. If you get stuck, don’t give up!

Timeline Analysis: After the evidence acquisition you will start doing your investigation and analysis in your forensics lab. Start by doing a timeline analysis. This is a crucial step and very useful because it includes information such as when files were modified, accessed, changed and created in a human readable format, known as MAC time evidence. The data is gathered using a variety of tools and is extracted from the metadata layer of the file system (inode on Linux or MFT records on Windows) and then parsed and sorted in order to be analyzed. Timelines of memory artifacts can also be very useful in reconstructing what happen. The end goal is to generate a snapshot of the activity done in the system including its date, the artifact involved, action and source. The creation is an easy process but the interpretation is hard. During the interpretation it helps to be meticulous and patience and it facilitates if you have comprehensive file systems and operating system artifacts knowledge. To accomplish this step several commercial or open source tools exists such as the SIFT Workstation that is freely available and frequently updated.

Media and Artifact Analysis: In this step that you will be overwhelmed with the amount of information that you could be looking at.  You should be able to answer questions such as what programs were executed, which files were downloaded, which files were clicked on, witch directories were opened, which files were deleted, where did the user browsed to and many others. One technique used in order to reduce the data set is to identify files known to be good and the ones that are known to be bad. This is done using databases like the Nation Software Reference Library from NIST and hash comparisons using tools like hfind from the Sleuth Kit.  In case you are analyzing a Windows system you can create a super timeline. The super timeline will incorporate multiple time sources into a single file. You must have knowledge of file systems, windows artifacts and registry artifacts to take advantage of this technique that will reduce the amount of data to be analyzed. Other things that you will be looking is evidence of account usage, browser usage, file downloads, file opening/creation, program execution, usb key usage. Memory analysis is another key analysis step in order to examine rogue processes, network connections, loaded DLLs, evidence of code injection, process paths, user handles, mutex and many others. Beware of anti-forensic techniques such as steganography or data alteration and destruction, that will impact your investigation analysis and conclusions

String or Byte search: This step will consist into using tools that will search the low level raw images. If you know what you are looking then you can use this method to find it. Is this step that you use tools and techniques that will look for byte signatures of know files known as the magic cookies. It is also in this step that you do string searches using regular expressions. The strings or byte signatures that you will be looking for are the ones that are relevant to the case you are dealing with.

Data Recovery: This is the step that you will be looking at recover data from the file system. Some of the tools that will help in this step are the ones available in the Sleuth Kit that can be used to analyze the file system, data layer and metadata layer.  Analyzing the slack space, unallocated space and in-depth file system analysis is part of this step  in order to find files of interest. Carving files from the raw images based on file headers using tools like foremost is another technique to further gather evidence.

Reporting Results: The final phase involves reporting the results of the analysis, which may include describing the actions performed, determining what other actions need to be performed, and recommending improvements to policies, guidelines, procedures, tools, and other aspects of the forensic process. Reporting the results is a key part of any investigation. Consider writing in a way that reflects the usage of scientific methods and facts that you can prove. Adapt the reporting style depending on the audience and be prepared for the report to be used as evidence for legal or administrative purposes.


References and further reading:

SANS 508 – Advanced Computer Forensics and Incident Response
Guide to Integrating Forensic Techniques into Incident Response
  (pub. #: 800-86), 2006, US NIST
Computer Security Incident Handling Guide (pub. #: 800-61), 2004, US NIST
The ComplexWorld of Corporate CyberForensics Investigations by Gregory Leibolt


Tagged , , , , , , ,