[The post below contains some notes I wrote about Linux memory forensics using LiME and Volatility to analyze a Red Hat 6.10 memory capture infected with Diaphormine and Reptile, two known Linux Kernel Module rootkits.]
Back in 2011, Joe Sylve, Lodovico, Marziale, Andrew Case, and Golden G. Richard published a research paper on acquiring and analyzing memory from Android devices “Acquisition and analysis of volatile memory from android devices” [1]. At Shmoocon 2012, Joy Sylve gave a presentation titled “Android Mind Reading: Memory Acquisition and Analysis with DMD and Volatility“[2]. This work was the precursor of Linux Memory Extractor aka LiME [3]. LiME is an open source tool, created by Joy Sylve, that allows incident responders, investigators and others to acquire a memory sample from a live Linux system.
Some years before, The Volatility Framework was developed based on the research that was done by AAron Walters and Nick Petroni on Volatools [4] and FATkit [5]. The first release of the Volatility Framework was released in 2007. In 2008 the volatility team won the DFRWS challenge [6] and the new features were added to Volatility 1.3. At the moment, Volatility is a powerful, modular and feature rich framework that combines a number of tools to perform memory analysis. The framework is written in Python and allows plugins to be easily added in order to add features. Nowadays it is on version 2.6.1 and version 3 is due this month. It supports a variety of operating systems. To analyze memory captures from Linux systems, Andrew Case, in 2011 [7], introduced several techniques into the Volatility framework in order to analyze Linux memory samples. Since then, new plugins have been introduced and different kernel versions are supported. At the moment there are 69 Linux plugins available.
Worth to mention that Michael Hale Ligh, Andrew Case, Jamie Levy, AAron Walters wrote the book “The Art of Memory Forensics Detecting Malware and Threats in Windows, Linux, and Mac Memory” that was published by Wiley in 2014 and is a reference book in this subject.
LiME works by loading a kernel driver on the live system and dump the memory capture to disk or network. The only catch is that the loadable kernel module needs to be compiled for the exact version of the kernel of the target system. Volatility is then be able to interpret this memory capture, but it needs a profile that matches the system from where the memory was acquired. Building a Volatility profile is straightforward, but it requires kernel’s data structures and debug symbols obtained for the exact kernel version of the target system obtained using the dwardfump utility. This means that if you want to acquire a memory capture from a system in an enterprise, the incident response team will need to transfer LiME and Volatility code to the system and compile it in order to create the required files. Sometimes the target system won’t have the necessary dependencies and additional packages will need to be installed such as compilers, DWARF libraries, ELF utilities, Kernel headers, etc. This is a sensible step from a forensic standpoint. Hal Pomeranz, experienced forensics professional, has a few comments about this on the readme file from his Linux Memory Grabber utility [8].
In an ideal world all the requirements necessary to have LiME kernel module and Volatility profile for all your Linux kernel versions will be done in advance. This can be done and should be done during the preparation phase [9] of your incident response process. This phase/step is when incident response team prepares and trains for an incident. One thing that can be done is creating LiME modules and Volaility profiles for the Kernel versions of the systems that are running in production. This can be done directly on the system or on a pre-production system. Of course, I can tell you that based on my experience, this hardly happens. Its more common the case when an incident happens i.e., an attacker used a Linux system in an enterprise environment as a staging environment or used it to achieve persistence or use it to pivot into other network segments, there are no LiME kernel modules or Volatility profiles for the compromised system. Yes, the incident response team acquires live response data or a forensic image of the disk but the acquisition of memory can aid the investigation efforts.
During enterprise incident response its common to come across the need to analyze commercial Linux systems such as Red Hat that are running business applications. In this article I will be looking at a RedHat Enterprise Linux Server release 6.10 with code name Santiago.
The following illustration shows the steps for compiling LiME on the target system. I start by checking the Kernel version following by installing the necessary dependencies on this particular system. The LiME package can be retrieved from GitHub and can be made available to the target system using removable media, a network file share, or by copying into the system. Compiling LiME is an easy step.

Next step is to run LiME with the insmod command. This step will acquire a memory sample in LiME format and in this case I also told LiME to produce a hash of the acquired memory sample. As an example the memory capture is written to disk but in a real incident is should be written to a network share, removable media sent via the network. Finally, you can remove the module with rmmod.

After that, we need a Volatility profile for the Linux kernel version we are dealing with. On this version of RedHat I could not find a RPM for Libdwarf that contained the Dwarf tools. I had to get the source code from GitHub and transfer it to the system and compile it. Then, with the dependencies met I could compile and make the dwarf module.

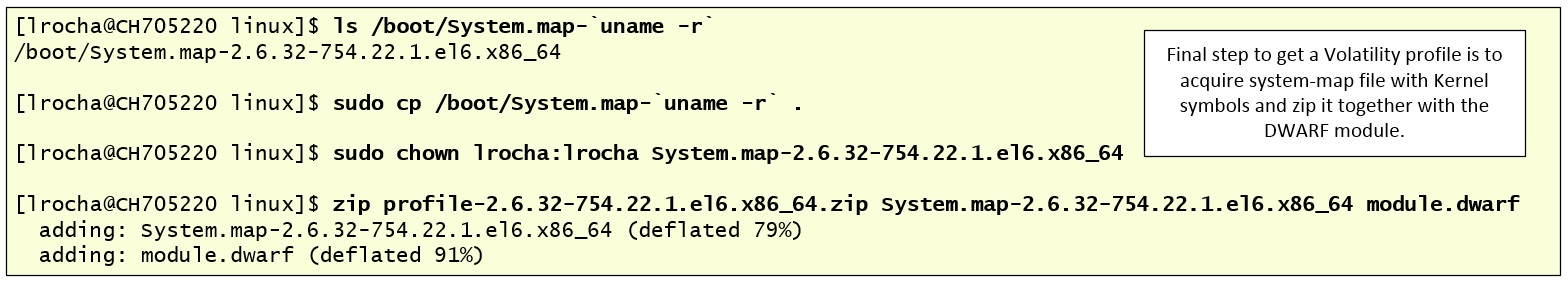
Finally, I acquired the system-map file and zipped it together with module.dwarf. This zip file needs to be placed in the volatility profiles folder or you can place it on a different folder and specify it in the command line.
Now that I have a profile for the Linux system that I can try different Volatility plugins. In this particular case I was interested in determining what I could observe when looking with Volatility on a memory capture from the system after it has been backdoored with publicly available rootkits. There are several Volatility plugins for Volatility that can help identifying rootkits [10]. Let’s review three that might help with rootkits that leverage Linux Kernel Modules..
The linux_check_modules plugin. This plugin will look for kernel loadable modules that are not listed under /proc/module but still appear under /sysfs/module and will show the discrepancies. There is also the linux_hidden_modules which will look at the kernel memory region where modules are allocated and scans for module structures. Modules appearing with this plugin might indicate they were released but still laying in memory or they are hiding.
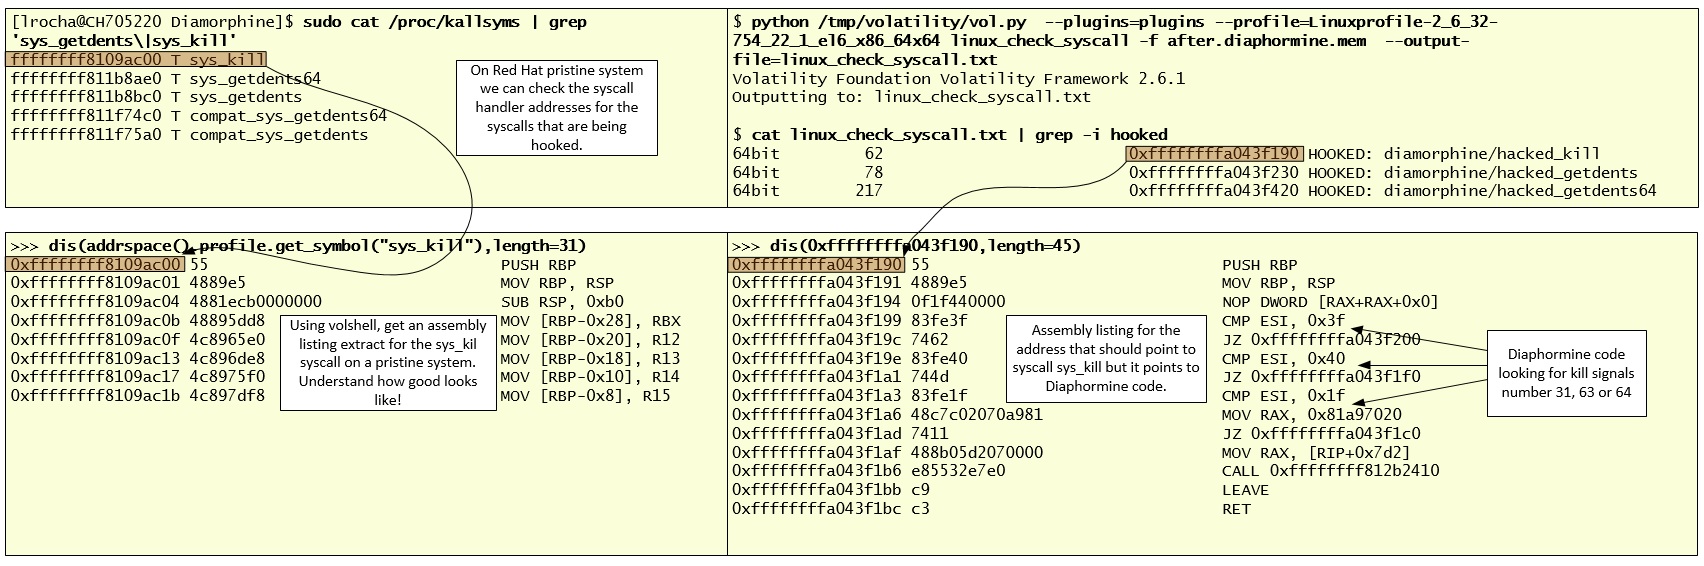
The linux_check_syscall plugin. This plugin will check if the sys_call_table has been modified. It lists all syscall handler function pointers listed in the sys_call_table array and it compares them with the address specified in the Kernel Symbols Table. If they don’t match, the message hook will be displayed.
The linux_check_kernel_inline plugin. This plugin will detect inline hooking. Among other things it will check if the prologue of specific functions in the kernel contains assembly instructions like JMP, CALL or RET. A match will display a message about the function that is being hooked.
In terms of Rootkits that leverage Loadable Kernel Modules I will look into Diamorphine [11] and Reptile [12]. Essentially, infecting the Red Hat system with the rootkit and capture a memory sample.
Let’s start with Diamorphine. Written by Victor Mello is a kernel rootkit written in C that supports Linux Kernels 2.6.x/3.x/4.x. It can hide processes, files and directories. It works by hooking the sys_call_table, more specifically it hooks the kill, getdents and getdents64 syscall handler addresses, making them point to the Diaphormine code. After loading into memory, the LKM module won’t be visible in /proc/modules but is still visible under /sys/module.
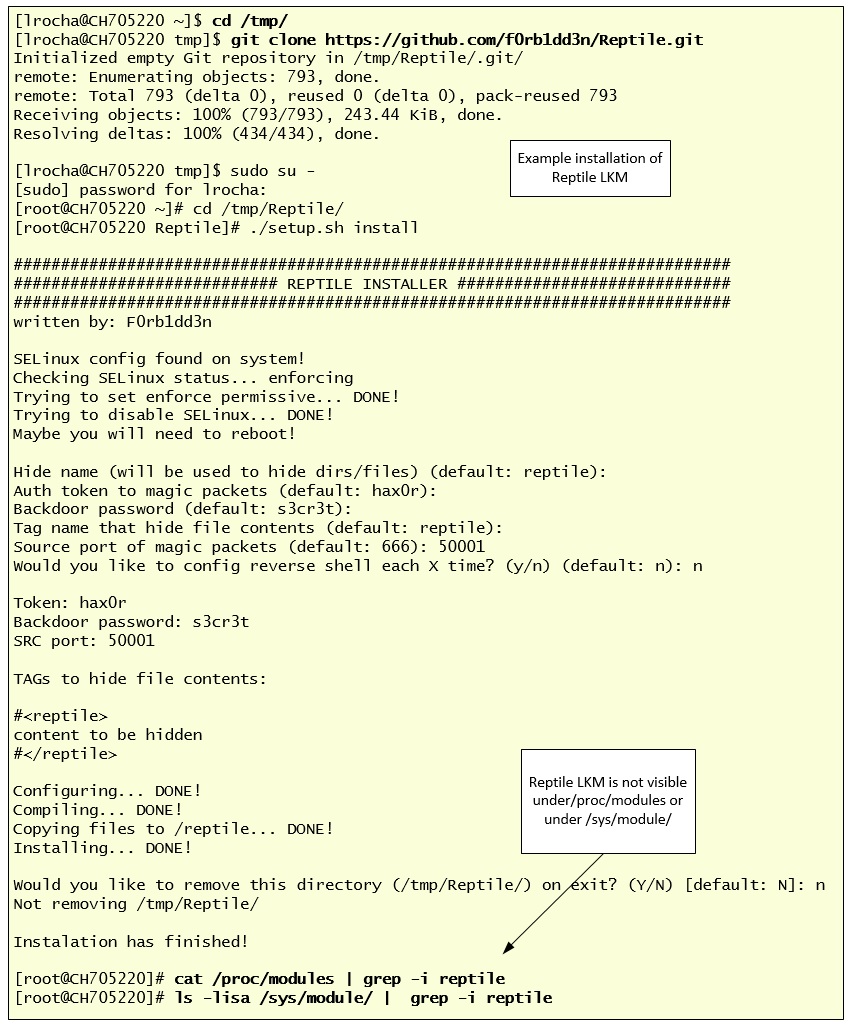
The following illustration shows, as an example, the Reptile installation on a Red Hat 6.10 system. It also shows that after the insertion of the malicious module into the Kernel, it doesn’t appear under /proc/modules. There is also a step on hiding a PID referent to bash process.

Following the previous steps, another memory sample was captured, and I ran the linux_check_modules Volatility plugin. As we could see, the plugin was able to find the Reptile module because he was still visible under /sysfs/module. We could dump the module to disk using the linux_moddump (didn’t worked for me at the time I tried it) and perform additional analysis in case this was something we were uncertain about. In this case I just looked at the first bytes of the module using linux_volshell plugin. The Volshell plugin was created in 2008 by Brendan Dolan-Gavitt. Following ilustration shows the usage of VolShell to print out 128 bytes in ASCII and look for interesting strings.

The other plugin worth to run is linux_check_syscall, which in this case is able to detect three hooked syscalls. Syscall 62, 78 and 217 which we can match against the syscall table from the pristine system, by looking at /proc/kallsyms, and check that the number corresponds to sys_kill, sys_getdents and sys_getdents64, respectively. Following that, and from a analysis perspective, I could use VolShell on the pristine memory dump and also on the one that has Diaphormine LKM loaded. Then I could list a few bytes in Assembly to compare and understand how good and bad looks like. In the following picture, on the left side, you can see the good sys_kill function and on the left side the bad one. Basically the syscall handler address was modified to point to the Diaphormine code.
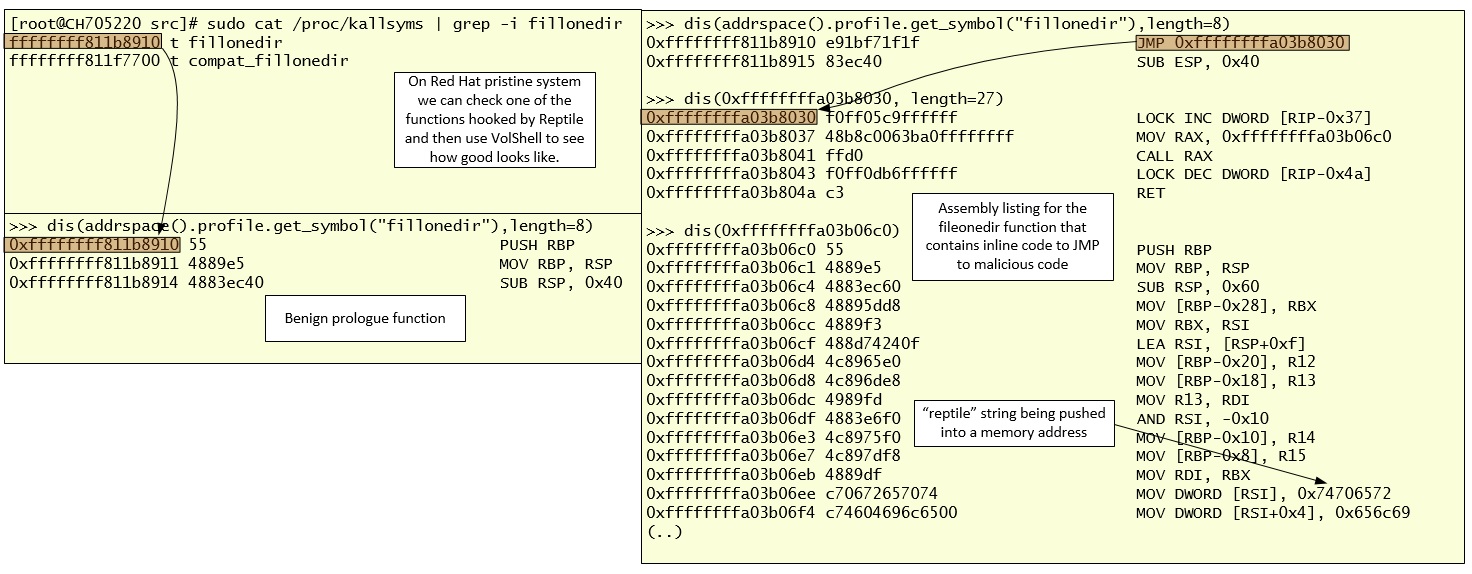
The other rootkit that is worth to look at is Reptile. It was written by Ighor Augusto and is a feature rich rootkit with features like port knocking. It is written in C and under the hood it uses the Khook framework. You can see the presentation “Linux Kernel Rootkits Advanced Techniques” from Ilya Matveychikov and Ighor Augusto that was given during H2HC 2018 [13] conference at São Paulo, Brasil where Reptile was released. Khook, among other things, instead of hooking the sys_call_table it uses a different technique that patches a function prologue with a JMP instruction. With the Volatility linux_check_syscal plugin we can’t detect this hooking technique since the syscall handler addresses have not been modified but it can be identified with linux_check_kernel_inline. Among other things, Reptile hooks fillonedir(), filldir(), filldir64(), compat_fillonedir(), compat_filldir(), compat_filldir64(), __d_lookup(). To hide processes, it hooks tgid_iter() and next_tgid(). To hide network connections, it hooks tcp4_seq_show and udp4_seq_show.
The following illustration shows, as an example, the Reptile installation on a Red Hat 6.10 system.
After compromising a system with Reptile and acquiring a memory capture, I executed the mentioned plugins. I started with linux_hidden_modules to look for LKM structures in the Kernel Memory. Volatility was able to find the Reptile LKM. Then we could dump the module to disk and perform additional static analysis.

The other plugin executed is linux_check_inline_kernel. It was able to detect several network related functions that were patched by the Reptile code. I didn’t had time to further investigate why the Hook Address is not shown but we can get futher details with Volshell.

The following picture shows a comparison of a good tcp4_seq_show function on the left side from a memory capture of a pristine system and, on the right, it shows the same function but as we could see it has been patched to jump (JMP) to the Reptile code.
![]()
Another function that is patched by Reptile code in order to hide directories is the filleonedir. Not sure why Volatility didn’t detected this but the plugin might be easily adjustable to perform further checks and detect it. On the image below, on the left side, I used Volshell to check the function prologue on a pristine system. On the right side, we can see how the patched function looks like.
That’s it for today. In this post I shared some notes on how to use different Volatility plugins to detect known Rootkits that leverage Linux Kernel Modules. The memory capture was obtained using LiME and and instructions were given on how to acquire the memory capture and create a Volatility profile. Nothing new but practice these kind of skills, share your experiences, get feedback, repeat the practice, and improve until you are satisfied with your performance. Have fun!
[1] http://www.dfir.org/research/android-memory-analysis-DI.pdf
[2] https://www.youtube.com/watch?v=oWkOyphlmM8
[3] https://github.com/504ensicsLabs/LiME
[4] https://www.blackhat.com/presentations/bh-dc-07/Walters/Paper/bh-dc-07-Walters-WP.pdf
[5] http://4tphi.net/fatkit/papers/fatkit_journal.pdf
[6] http://volatilesystems.blogspot.com/2008/08/pyflagvolatility-team-wins-dfrws.html
[7] http://dfir.org/research/omfw.pdf
[8] https://github.com/halpomeranz/lmg
[9] https://nvlpubs.nist.gov/nistpubs/SpecialPublications/NIST.SP.800-61r2.pdf
[10] https://github.com/volatilityfoundation/volatility/wiki/Linux-Command-Reference
[11] https://github.com/m0nad/Diamorphine
[12] https://github.com/f0rb1dd3n/Reptile/
[13] https://github.com/h2hconference/2018/
References:
SANS FOR526: Advanced Memory Forensics & Threat Detection
The Art of Memory Forensics Detecting Malware and Threats in Windows, Linux, and Mac Memory