Author Archives: Luis Rocha

Hacking Team Breach Summary

[The news on Twitter, on the media, and across the infosec community in the last days have been fascinating to due to the revelations from the Hacking Team breach. Details about how the company operates,  information about espionage and surveillance, zero days exploit catalogs, all the secrets and drama make this story ready for someone to write a book about it. Because I was on vacations while all this happened, I decided to write a short summary about it in order to catch-up. LR]

Sunday night, 5th of July, news started making the rounds about 400Gb of data stolen from the notorious Italian surveillance software company Hacking Team. With a quite epic start, the person behind the attack – someone that goes by the name Phineas Fisher – hijacked the company twitter account, changed the handler from Hacking Team to Hacked Team and posted the following message: “Since we have nothing to hide, we are publishing all our emails, files, and source code” with a torrent link to download the data.

hackingteam1

Shortly after, on the same twitter handle, print screens about the leaked data started to disseminate internal company emails, their clients and operating procedures. This continued for at least half day. Some hours later their list of clients have been posted on Pastebin revealing some questioning relationships with  countries known for human rights violations.  The company has been subject to criticism several times over the past years regarding the unethical sale of surveillance tools. CitizenLabs and Reporters Without Borders were organizations that went vocal in the past regarding their questionable practices. That known, the news were expected to have a lot of attention by the media, journalists, activists and others.

Meanwhile, as this was not enough, one of the companies employees Christian Pozzi came publicly to support the company. Unfortunately for him, his personal passwords were on the massive amount of data leaked. Worse was that the quality of the passwords were weak and moments after his initial twitter post, his twitter account got hijacked as well and his passwords posted online and twitted.

hackingteam3

Following, when people all over the world started to get their hands on the torrent file all kinds of confidential information started to arise. Sales revenue, contracts, budgets plans, agreements, emails, operating manuals, configuration files, source code, zero day exploit catalogs, and all kind of business and technical information started to be on the internet. Wikileaks indexed and made searchable all their emails.

The days after the breach have been quite revealing due to their software and capabilities – their main business is security services and tools to governments and law enforcement organizations – specially for the information security community due to the number on unknown zero day vulnerabilities exposed and their surveillance software. But, on the other hand, the criminals soon started to use the source code and exploits on spear phishing campaigns and the Neutrino and Angler exploit Kits started to leverage the Flash 0 days while Adobe and Microsoft were working on releasing patches. This topic deserves a post on its own and I will write a summary about it soon.

As expected, the company started to investigate who has been behind the breach. According to Reuters Italian prosecutors are investigating six former employees. Ars Technica also reports this here.

In the last days, Eric Rabe and David Vincenzetti, Hacking Team Chief Communications Officer and CEO respectively, have been quite brave and their twitter handler continues to post updates. On the company website there were several news released about this topic. Among other things they seem to have requested all their clients to suspend their operations and asked the Anti Virus companies to start detecting their software. hackingteam2

Phineas Fisher who claims to be the actor behind the breach used his dormant twitter account writing that he will released the details on how the company got hacked. Stay tuned!

Tagged

John the Ripper Cheat Sheet

I created a quick reference guide for John the Ripper. Useful for those starting in order to get familiar with the command line. Download it here: JtR-cheat-sheet.
Print it, laminate it and start practicing your password audit and cracking skills. Can also aid existing users when playing Hashrunner, CMIYC or other contests.

jtr-cheatsheetimg

Tagged , , ,

Hash Runner CTF – 2015

Image retrieved from http://blog.phdays.com/Positive Hack Days (PHD) is a well-known conference that is organized since 2011 by the company Positive Technologies. The PHD conference is held annually at Moscow and every year contains great talks and even greater CTF  – Capture the Flag – challenges. One of the CTF challenges is called Hash Runner. This year Hash Runner was held during the last weekend. Hash Runner is a hands-on exercise where the participants are given the chance to test their skills at cracking passwords. Basically, there is a list of hashes available at the beginning of the contest. These hashes have been generated using a variety of algorithms and different password complexity schemes. It’s the participants job to guess the password by only having the password representation that was produced using one of the algorithms.  As soon as there is a match it should be submitted to the contest. Points will be given according to the difficulty/cost of computing such the algorithm that produced the hash. For example computing LANMAN, MD5 or SHA1 hashes will give you the less points. On the other hand, algorithms such as HMAC-PBKDF2-SHA512, Bcrypt or GOST-512 will give you the most points but they are very resource intensive to compute.

Anyone could take part of the CTF and join a team or participate alone. Of course if you are in a team you will have more chances to succeed. Every year teams such as Hashcat, InsidePro and John-Users – that are well known for their computing power and very smart people – participate to dispute the first place.

This year I had the chance to participate. Thanks to Aleksey Cherepanov and Solar Designer  – Alexander Peslyak – for accepting me in John-Users team.

The attempt to recover a password just by knowing its encrypted representation can be made mainly using three techniques. Dictionary attacks, which is the fastest method and consists of comparing the dictionary word with the password hash. Another method is the brute force attack, which is the most powerful one but the time it takes to recover the password might render the attack unfeasible. This is of course dependable on the complexity of the password and the chosen algorithm. Finally there is the hybrid technique which consists of combining words in a dictionary with word mangling rules. This technique is one of the strengths of JtR. The only tool used by John-Users during the all contest.

The team with the biggest muscles have an advantage to win the competition due to the resources that they have at their disposal. Having a GPU monster like Brutalis will definitely help. However, brains are also important to find patterns and logic behind the password generation which will increase the likelihood to find passwords generated with demanding computing algorithms. Nonetheless, this year there were notable coding efforts that needed to be made to support different encoding formats, salts and algorithms. This adds excitement and an extra challenge to the competition. Here is where my skills lack however it was noteworthy to see throughout the all contest very smart people working extremely hard developing on-the-fly code to JtR.

In addition during the contest there were bonus hashes that will give you extra points. This bonus hashes will be available to the teams when they reach a certain threshold in their score – great to see the organizers adding this different levels to the contest format.

This type of events are very good to practice information security skills. In this particular case was great in order to understand and learn more about passwords, algorithms, John the Ripper and learn from experienced team members. Bottom line we got silver medal and Hashcat won gold – here the last scorecard.

Great fun, excellent learning exercise, great team!

Tagged , , ,

Step-by-Step Clustering John the Ripper on Kali

image retrieved from hackernews.com

Below a quick step-by-step guide on how to install and run the latest version of John the Ripper across several system using OpenMPI framework taking advantage of NFS to share common files. All this using Kali Linux. By creating this small environment we foster the knowledge and promote learning about different tools and techniques. The goal is understand attack methods in order to create better defenses.

Lets first review our arsenal. On all the machines we will be running Kali Linux. Kali is one of the best suites available to practice, learn and perform offensive techniques. This distribution brings the instruments needed in order to execute the steps an intruder will eventually perform during an attack. Depending on the reader’s choice, Kali Linux is available in ISO or VM. In our case we will be downloading the ISO and installing it on the different systems. Please note all the steps will be done using the privileged root account due to the Kali Linux Root Policy. Therefore is recommended you run this type of scenarios in a controlled and isolated lab environment.

We will use John the Ripper (JtR) which is a remarkable piece of software. Extremely feature rich, very fast, free and actively maintained. Today is still one of the best tools available for password cracking – definitely the best when using CPUs’ . The tool was developed  by Alexander Peslyak, better known as Solar Designer. JtR can be downloaded from http://www.openwall.com/john/ and comes in two flavors.  One is the official version and the other is the community-enhanced version known as “jumbo”. In this exercise we will be using the latest community edition which was released last December.

Then we will need OpenMPI. For those who might know the open source version of the MPI framework allow us to parallelize the load of JtR across multiple systems. MPI stands for the Message Passing Interface and is a API used for high-end computing topics such as parallel computing and multi-core performance. The OpenMPI implementation is developed and maintained by a consortium of academic, research, and industry partners. JtR community edition supports OpenMPI.

Finally, to share the files across the different systems we will configure the NFS protocol. In this way we will put the shared files (wordlists, dictionaries, hashes, pot file, etc..) on the master node making them accessible to any computer on the network.

The steps needed to build this setup are:

  • Install and configure the network environment.
  • Generate and distribute SSH keys and start SSH deamon.
  • Install and configure NFS on the server and clients.
  • Install OpenMPI on the master node.
  • Install JtR 1.8 Jumbo edition with OpenMPI support.
  • Copy hashes and wordlists to NFS share.
  • Launch JtR with Mpiexec.
  • Verify status and progress with skill/pkill.

For sake of brevity we will skip the first step which consists on getting the machines up and running with Kali Linux and and IP address so they can communicate between them In our case the environment looks like the following picture. A master node where we will run the NFS server and from where we will launch JtR using OpenMPI framework to distribute the load. And a set of other nodes which will have Kali Linux.

jtr-network

After building the mentioned environment and making sure all machines can communicate properly we go to next step. Generate and distribute SSH keys and start the SSH daemon. Essentially, generate a RSA private and public key on the master node. Then copy the public key all notes, add it to the authorized keys and change its permissions. Next, configure SSH to start during boot and start the service. These steps are illustrated below in detail.

jtr-ssh

Afterward install and configure NFS on the server and clients. To perform the installation depending on the way Kali Linux was installed and the version, the repositories might need to be updated and the GPG keys as well. To perform this the source.list file should contain the repository sources listed below and in case “apt-get update” complains about expired GPG keys the new key ring needs to be installed. Then install NFS server and Portmap (Portmap or RPCbind are the same thing). Following create a folder that will be your NFS share and change the permissions. Then this directory needs to be added to the /etc/exports file so that when NFS server starts he knows what to mount and what is the access level.. Load the config file and start the services. Finally login into each one of the nodes, create the same directory and mount it as a NFS share. These steps are illustrated below in detail.

jtr-nfs


Next, on the master node install OpenMPI framework, download the latest version of JtR, uncompress, configure it with the –enable-mpi suffix and compile it. Then you need to repeat the JtR instalation steps on each one of the nodes and make sure it is installed on the same directory across all systems. These steps are illustrated below in detail. Please note the OpenMPI feature is only good when you want to run on multiple systems. if you want to run on multiple cores but just on one system you can use the -fork option when invoking JtR.

jtr-inst

Finally, you copy the hashes and your preferred wordlist to the NFS. Then you start JtR from the master node by invoking Mpiexec. To perform that you first need a file that in this case we will call mpi-nodes.txt that contains a list of the nodes on your network and the number of CPU cores available per node. Then you run mpiexec using the -hostfile suffix and you invoke john. In this case we are running john using the default mode. It uses also a shared pot file. Note that for the shared pot file “You may send a USR2 signal to the parent MPI process for manually requesting a “pot file sync”. All nodes will re-read the pot file and stop attacking any hashes (and salts!) that some other node (or independant job) had already cracked.”

jtr-mpi

From this moment onwards you can start practice the different techniques that John allows to perform with its powerful mangling rules. The rules are available on john.conf and this version already includes the Korelogic rules. To know what the rule will do to the provided wordlist you can use the command like this “./john  –wordlist=/var/mpishare/rockyou.txt –rules:Korelogic –stdout”. Below a couple of example of rules that one might want to try.

jtr-rules

If you want to continue the journey, a proposed next step would be to further expand your skills using JtR by reading the available documentation under the doc folder where JtR was installed. Read the articles from the JtR wiki and then try out some advanced stuff like playing with KoreLogic rules and the hashes available from KoreLogic that have been used during the Crack Me if you Can contest on Defcon.

That’s it! Even though there are plenty of books and open source information that describe the methods and techniques demonstrated, the environment was built from scratch.  The tools and tactics used are not new. However, they are relevant and used in today’s attacks. Likewise, the reader can learn, practice and look behind the scenes to better know them and the impact they have

From a defensive perspective  choose a password that is strong enough to the point that the amount of effort an attack must spent to break it is bigger than the lifetime of the passwords. In other words, use strong passwords, don’t reuse them and change them often.


References:

http://openwall.info/wiki/john/tutorials

Click to access Rick_Redman_-_Cracking_3.1_Million_Passwords.pdf

https://www.owasp.org/images/a/af/2011-Supercharged-Slides-Redman-OWASP-Feb.pdf
http://blog.thireus.com/cracking-story-how-i-cracked-over-122-million-sha1-and-md5-hashed-passwords\
http://blog.thireus.com/category/hack1ng/crack1ng
http://pentestmonkey.net/cheat-sheet/john-the-ripper-hash-formats


Tagged , , ,

Thoughts on Measuring Security Monitoring

Measuring-StickWith increasing frequency on security incidents and greater than ever focus on the security posture of organizations, you as a manager or as an engineer, are being called to be able to measure the impact of your security controls. In other words, there is a high demand for being able to report, measure and provide situational awareness about your people, process and technologies that are related to the security business. Essentially, being able to measure something that would produce actionable insights that will result in more effective and efficient services.

That being written, below some random thoughts about this topic. My background is engineering, not economy or business management but is common sense that in any operational business metrics are key in order to improve management and delivery of the services. Security should not be an exception. However, if you consider your organization end-to-end security stack (e.g. from the endpoint AV and operating system patches to the DDoS detection and mitigation controls) there is a huge variety of data sources that don’t have a common interface. This means whenever you want to measure something it will be manually and labor intensive i.e., the metrics are not cheap to gather. Now, if you put on top of that the people and processes aspect it will be even harder to measure.

Anyway, you also don’t want to measure just something just because you can. Metrics should support your mission and help you having a clear picture on how well are you performing. In addition as stated by Andrew Jaquity on his book “Security Metrics – Replacing Fear, Uncertainty, and Doubt”, good metrics should be consistently measured, gathered in an automated way, expressed in a number or percentage and expressed using a unit of measure like hours or dollars – I really recommend his book – .

As industry matures, we are getting better and better at measuring the different processes and different security controls. There are many well defined metrics and the book mentioned previously is a great resource. But let’s consider a practical example. A security monitoring function, maybe within a Security Operations Center.  What do we want to measure and report? It depends on the size, scope and maturity level of the organization but below some reporting goals that one might chose in order to support the overall mission:

  • Provide end to end effectiveness metrics about operational readiness to detect and block threats.
  • Periodic benchmark about operational readiness to detect and block threats.
  • Minimize the risk of attacks that could result in lost revenue, public embarrassment, and/or regulatory penalties.

So, if you stated your reporting goals what would you achieve with those? what might be the outcomes?

  • Enable informed business decisions by producing actionable intelligence and situational awareness.
  • Being able to plan for, manage and respond to all categories of threats – even as they become more frequent and more severe.
  • Minimize false positives and harmless security incidents focusing on valuable and meaningful incidents.
  • Facilitate strategic decisions to improve the security monitoring service by looking at the big picture.
  • Guide the resource allocation.
  • Help diagnose problems.

Now that we might have the goals and the benefits of reaching those goals let’s consider how we do it. First might be a manual approach by gathering the different data sources, extracting the data, consolidate the information, produce the dashboards/graphs, analyze the data and provide the actionable recommendations. Then you improve from there in an incremental approach by producing a mature and consistent process that generate the metrics in an automated fashion.  The content of your report or dashboard might contain:

  • Total number of devices being monitored.
  • Volume of events, incidents and tickets that were handled (both the number and the type).
  • Resolution times (a measure of the length of time from when the incident/ticket was received, the length of time from when the incident/ticket was dispatched, etc.).
  • Number of employees (e.g. Cost).
  • Headcount to Ticket ratio (e.g.,Improve the per capita security incidents ratio enabling a close monitor of the workload that might contributes to a better/worse work environment).
  • Number of employee certifications ( how well-trained and well-equipped is your team?).
  • Events/Incidents generated per region, device, signature (top talkers, outliers, trends..).

With these metrics we start to have answers to basic questions that business leaders might have such as:

  • Are security incidents going up or down?
  • Does the security operations team respond quickly to the different incidents?
  • Does the regional SOC ranks favorably when compared with other regional SOC (both in volume and per capita security incidents rate).
  • How effective is the SOC?
  • Is the SOC running better off than it was last month/quarter/year?


Tagged , , , ,

Memory Forensics with Volatility on REMnux v5 – Part 2

Before we continue our hands-on memory forensics exercise, will be good to refresh some concepts on how memory management works on Windows 32 bits operating systems running on x86 architecture. Windows operating systems have a complex and sophisticated memory management system. In particular the way the mapping works between physical and virtual addresses is a great piece of engineering.  On 32 bits x86 machines, virtual addresses are 32 bits long which means each process has 4GB of virtual addressable space. In a simplified manner the 4GB of addressable space is divided into two 2GB partitions. One for user mode processes – Low 2GB (0x00000000 through 0x7FFFFFFF) -and another for the Kernel mode – High 2GB (0x80000000 through 0xFFFFFFFF). This default configuration could be changed in the Windows boot configuration data store (BCD) to accommodate 3GB for user mode.  When a process is created and a region of virtual address space is allocated – trough VirtualAlloc API – the memory manager creates a VAD (Virtual Address Descriptor) for it. The VAD is essentially a data structure that contains the various elements of the process virtual addresses organized in a balanced tree. Elements such as the base address, access protection, the size of the region, name of mapped files and others are defined on each VAD entry.  The Microsoft Windows Internals book goes over in great detail about it.

Fortunately, Brendan Dolan-Gavitt, back in 2007 created a series of plugins for The Volatility Framework to query, walk and perform forensic examinations of the VAD tree. His original paper is available here.

That being said the next step in our quest to find the malicious code. We will use these great plugins to look at the memory ranges that are accessible by the suspicious process virtual address space. This will allows us to look for hidden and injected code. Worth to mention that a great book with excellent resources and exercises about this matter is the Malware Analyst Cookbook from Michael Ligh et. al. Another great resource that also goes into great detailed and was published last year is the Art of Memory Forensics also from Michael Ligh and the Volatility team.  Both books mention that among other things the VAD  might be useful to find malicious code hiding in another process. Essentially, by looking at the memory ranges that have an access protection marked as executable specially with the  PAGE_EXECUTE_READWRITE protection. This suggest that a particular memory range might be concealing executable code. This has been demonstrated by Michael Ligh and was translated into a Volatility plugin named Malfind. This plugin, among other things, detects code that might have been injected into a process address space by looking at its access protections.  For this particular case Malfind does not produce results for the explorer.exe (PID 1872). Might be due to the fact that permissions can be applied at a further granularity level than the VAD node level.

Our next hope is to start looking at the different VAD attributes and mapped files of the VAD tree for this suspicious process using the Vadinfo plugin. The Vadinfo plugin goes into great detail displaying info about the process memory and the output might be vast. For the sake of brevity only the first entry is displayed in the following picture.

memory-analysis-8

In this case the output of the Vadinfo plugin displays almost two hundred VAD nodes and its details. Because we are looking for specific IOCs that we found we want to further look into these memory regions. This is where the Vaddump plugin comes to great help. Vaddump is able to carve our each memory range specified on the VAD node and dump the data into a file.

memory-analysis-9

Then we can do some command line kung-fu to look into those files. We can determine what kind of files we have in the folder and also look for the indicators we found previously when performing dynamic  analysis.  In this case we could observe that the string “topic.php” appears in five different occasions using the default strings command. In addition it appears once when running strings with a different encoding criteria – and this exactly matches the found IOC.

memory-analysis-10

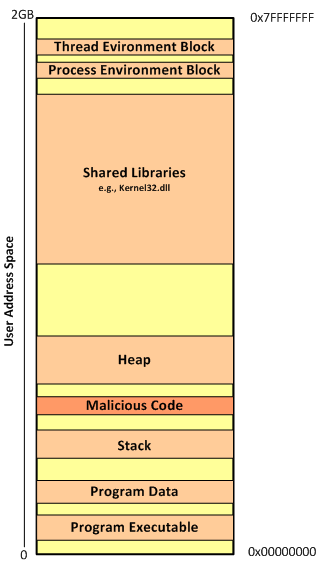
On a side note is interesting to see based on the file names the memory ranges that span the virtual address space from 0x00000000 to 0x7FFFFFFF. And you also could see that there is some groups of addresses more contiguous than others. This related on how the process memory layout looks like. The following image illustrates this layout on a x86 32bit Windows machine. This can be further visualized using VMMap tool from Mark Russinovich and available on the Sysinternals Suite.

memory-analysis-13

Back to our analysis, one first step is to look across dumped data from the Vaddump plugin see if there is any interesting executables files. We observed that the previous search found several Windows PE32 files. Running again our loop to look for Windows PE32 files we see that it contains 81 executables. However, we also know the majority of them are DLL’s. Lets scan trough the files to determine which ones are not DLL’s. This gives good results because only two files matched our search.

memory-analysis-14

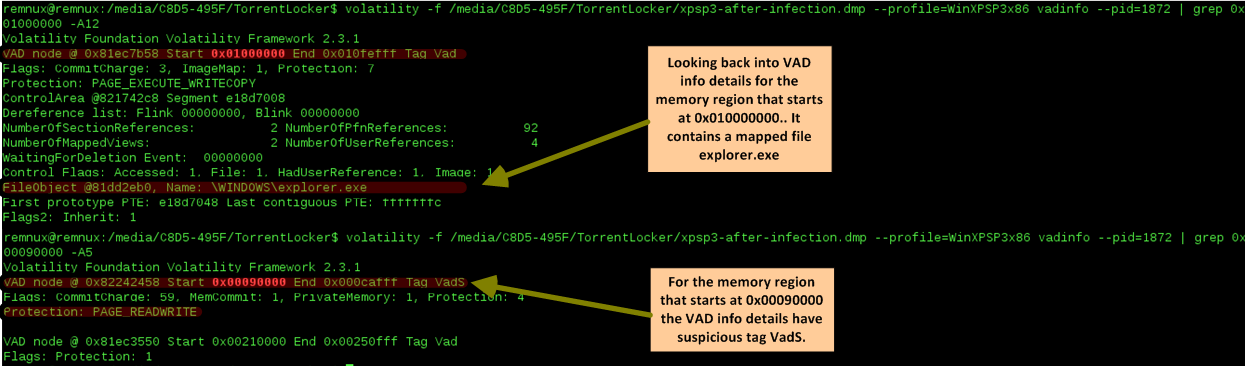
Based on the two previous results we run again the Vadinfo plugin and looked deeper into those specific memory regions. The first memory region which starts at 0x01000000 contains normal attributes and a mapped file that matches the process name. The second memory regions which starts at 0x00090000 is  more interesting. Specially the node has the tag VadS. According to Michael Ligh and the Volatility Team this type of memory regions are strong candidates to have injected code.

memory-analysis-15

Next step? run strings into this memory region to see what comes up and don’t forget to run strings with a different encoding criteria.

As you could see below, on the left side, we have a small set of the strings found on the memory region. This information gives great insight into the malware capabilities, gives further hints that can be used to identify the malware on other systems and can further help our analysis. On the right side you have a subset of the strings found using a different encoding criteria. This goes together with previous strings and  gives you even further insight into what the malware does, its capabilities and the worst it can do.

memory-analysis-16

Security incident handlers might be satisfied with dynamic analysis performed on the malware because they can extract IOCs that might be used to identify the malware across the  defense systems and aid the  incident response actions. However, trough this exercise we gained intelligence about what the malware does by performing memory forensics. In addition, as malware evolves and avoids footprints in the hard drive the memory analysis will be needed to further understand the malware capabilities. This allows us to augment prevention controls and improve detection and response actions. Nonetheless, one might want to even go further  deep and not only determine what the malware does but also how.  That being said the next logical step would be to get the unpacked malware from memory and perform static analysis on the sample. Once again, Volatility Framework offers the capability of extracting PE files from memory. Then they can be loaded into a dissasembler and/or a debugger. To extract these files from memory there are a variety of plugins. We will use the dlldump plugin because it allows you to extract PE files from hidden or injected memory regions.

There are some caveats with the PE extraction plugins and there is a new sport around malware writers on how to manipulate PE files in memory or scramble the different sections so the malware analysts have a tougher time getting them. The Art of Memory Forensics and the The Rootkit Arsenal book goes into great detail into those aspects.

memory-analysis-17

With the malware sample unpacked and extracted from memory we can now go in and perform static analysis … this is left for another post.

That’s it – During the first part we defined the  steps needed to acquire the RAM data for a VMware virtual machine before and after infection.  Then, we started our quest of malware hunting in memory. We did this by benchmarking both memory captures against each other and by applying the intelligence gained during the dynamic analysis. On the second part we went deeper into the fascinating world of memory forensics. We manage to find the injected malware in memory that was hidden in a VAD entry of the explorer.exe process address space. We got great intel about the malware capabilities by looking at strings on memory regions and finally we extracted the hidden PE file. All this was performed  using the incredible Volatility Framework that does a superb job removing all the complex memory details from the investigation.


Malware sample used in this exercise:

remnux@remnux:~/Desktop$ pehash torrentlocker.exe
file:             torrentlocker.exe
md5:              4cbeb9cd18604fd16d1fa4c4350d8ab0
sha1:             eaa4b62ef92e9413477728325be004a5a43d4c83
ssdeep:           6144:NZ3RRJKEj8Emqh9ijN9MMd30zW73KQgpc837NBH:LhRzwEm7jEjz+/g2o7fH


References:

Ligh, M. H., Case, A., Levy, J., & Walters, A. (2014). Art of memory forensics: Detecting malware and threats in Windows, Linux, and Mac memory
Ligh, M. H. (2011). Malware analyst’s cookbook and DVD: Tools and techniques for fighting malicious code.
Russinovich, M. E., Solomon, D. A., & Ionescu, A. (2012). Windows internals: Part 1
Russinovich, M. E., Solomon, D. A., & Ionescu, A. (2012). Windows internals: Part 2
Blunden, B. (2009). The rootkit arsenal: Escape and evasion in the dark corners of the system.
Zeltser, Lenny (2013) SANS FOR610: Reverse-Engineering Malware: Malware Analysis Tools and Techniques

Tagged , , , , , , ,

Memory Forensics with Volatility on REMnux v5 – Part 1

As threats and technology continue to evolve and malware becomes more sophisticated, the acquisition of volatility data and its forensic analysis is a key step during incident response and digital forensics. This article is about acquiring RAM from a disposable virtual machine before and after malware infection. This data will then be analyzed using the powerful Volatility Framework. The steps described here go hand in hand with the steps described on previous blog posts here and here about dynamic malware analysis.

We will use the methodology stated in previous post. We will start the virtual machine in a known clean state by restoring it from a snapshot or starting a golden copy. Then we will suspend/pause the machine in order to create a checkpoint state file. This operation will create a VMSS file inside the directory where the virtual machine is stored. Then we will use a tool provided by VMware named Vmss2core to convert this VMSS file into a WinDbg file (memory.dmp).  From VMware website: Vmss2core is a tool to convert VMware checkpoint state files into formats that third party debugger tools understand. Last version is available here. It can handle both suspend (.vmss) and snapshot (.vmsn) checkpoint state files as well as both monolithic and non-monolithic (separate .vmem file) encapsulation of checkpoint state data. This tools will allow us to convert the VMware memory file into a format that is readable by the Volatility Framework.

Next, we restore the virtual machine to back where it was and we infect it with malware. After that, we suspend the machine again and repeat the previous steps. This allow us to have two memory dumps that we can compare against each other in order to facilitate the finding of malicious code.

memory-analysis-2To perform the analysis and the memory forensics we will use the powerful Volatility Framework. The Volatility Framework born based on the research that was done by AAron Walters and Nick Petroni on Volatools and FATkit. The first release of the Volatility Framework was released in 2007. In 2008 the volatility team won the DFRWS and added the features used in the challenge to Volatility 1.3.  Seven years have passed and this framework has gained a lot of popularity and attention from the security community. The outcome has been a very powerful, modular and feature rich framework that combines a number of tools to perform memory forensics. The framework is written in Python and allows plugins to be easily added in order to add features. Nowadays it is on version 2.4, it supports a variety of operating systems and is being actively maintained.

Below the  steps needed to acquire the RAM data for a VMware virtual machine:

  • Restore the VMware snapshot to a known clean state.
  • Pause the Virtual Machine
  • Execute vmss2core_win.exe
  • Rename the memory.dmp file to memory-before.dmp
  • Resume the virtual machine
  • Execute the malware
  • Pause the virtual machine
  • Execute vmss2core_win.exe
  • Rename the memory.dmp file to memory-after.dmp

The following picture ilustrates the usage of Vmss2core_win.exe.

memory-analysis-3

After performing this steps we can proceed to the analysis. First we move the memory dumps to REMnux. Then we start the Volatility Framework which comes pre-installed. We start our analysis by listing the process as a tree using the “pstree” module on both the clean and infected memory image. With this we can benchmark the infected machine and easily spot difference on infections performed by commodity malware.  In this case we can easily spot that on the infected machine there a process named explorer.exe (PID 1872) that references a parent process (PPID 1380) that is not listed. In addition we can observe the processes vssadmin.exe (PID 1168) and iexplorer.exe (PID 1224) which were spawned by explorer.exe.  Vsadmin.exe can manage volume shadow copies on the system. This strongly suggests that we are in presence of something suspicious.

memory-analysis-4


Next step is to do a deep dive. During the previous dynamic malware analysis articles series were we analyzed the same piece of malware we were able to extract indicators of compromise (IOC). These IOC’s were extracted  from our analysis performed at the network level and system level. We will use this information for our own advantage in order to reduce the effort needed to find Evil. We knew that after the infection the malware will attempt to contact the C&C using a HTTP POST request to the URL topic.php which was hosted in Russia.

Let’s use this pieces of information to search and identify the malicious code. To perform this we will look for ASCII and UNICODE strings that match those artifacts using src_strings utility that is part of The Sleuth Kit from Brian Carrier and is installed on REMnux.

memory-analysis-5

The  parameter “-t d” will tell the tool to print the location of the string in decimal. We save this findings in a text file. The results are  then used by Volatility. Next, we invoke Volatility and use the “strings” plugin that can map physical offsets to virtual addresses – this only works on raw memory images and not on crash dumps – . It works by traversing all the active processes  and is able to determine which ones accessed the specified strings.  In case of a match we will have a good hint on where the malicious code might reside. In this case the plugin is able to match the strings with the process ID 1872 on two different virtual addresses.  This corroborates the fact that on the previous step we saw this process without a parent process which was rather suspicions . Another clue that we might be in good direction.

memory-analysis-6

This can be easily confirmed by listing the process ID 1872 using the “pslist” module.   Given this fact we proceed with the extract of this process from memory to a file using the “procmemdump” plugin. Volatility Framework is so powerful that it can parse PE headers in memory and carve them out. With this plugin we can dump the process executable using its PID.  After extraction we can verify that the file commands correctly identifies the file as a PE32 executable. Then we can verify that the string we found previous is indeed part of this process.

memory-analysis-7

Well, looks like the string “topic.php” is not in the data we just extracted. However, as we could see in the previous analysis steps we determined that the actions performed by the malicious code were in the context of this process. Furthermore, during the basic static analysis performed (see previous post) on the malicious executable we saw that it references very few libraries but two of them were noteworthy. The LoadLibrary and GetProcAddress.  This suggest the malicious executable was either packed or encrypted. In addition those libraries suggest that  malicious code was injected into a process.  There are several techniques used by threat actors to inject malicious code into benign processes. I will expand on this techniques on a different blog post. As conclusion we might be looking at malicious code that was injected in the process explorer.exe (PID 1832) and is somehow concealed. This means we will need to look deeper into the obscure and fascinating world of memory forensics. Part two will follow!


Malware sample used in this exercise:

remnux@remnux:~/Desktop$ pehash torrentlocker.exe
file:             torrentlocker.exe
md5:              4cbeb9cd18604fd16d1fa4c4350d8ab0
sha1:             eaa4b62ef92e9413477728325be004a5a43d4c83
ssdeep:           6144:NZ3RRJKEj8Emqh9ijN9MMd30zW73KQgpc837NBH:LhRzwEm7jEjz+/g2o7fH

References:

Ligh, M. H. (2011). Malware analyst’s cookbook and DVD: Tools and techniques for fighting malicious code.
Zeltser, Lenny (2013) SANS FOR610: Reverse-Engineering Malware: Malware Analysis Tools and Techniques

Tagged , , , ,