
 In the previous article I showed how easily you could run American Fuzy Lop (AFL) to fuzz an open source target. I used a 64-bit system and used AFL to fuzz the 64-bits version of tcpdump. Today, I’m going to fuzz the 32-bit version of tcpdump. Why the 32-bit version? Because I would like to combine AFL with address sanitizer (ASAN). As written by Michal Zalewski on the “notes_for_asan.txt” document (AFL documentation), ASAN requires a lot of virtual memory. In certain circumstances, due to some input, it could cause a lot of memory consumption and cause system instability. Therefore, Michal suggests to use ASAN to fuzz a 32-bit target and tell AFL to enforce a memory limit. Other options are possible to combine AFL with ASAN on a 64-bit target such as using the option “ASAN_OPTIONS=hard_rss_limit_mb=N”, but I will keep it simple and try that. And why use ASAN? Because ASAN, is a fast memory error detector, created by Google (Konstantin Serebryany, Derek Bruening, Alexander Potapenko and Dmitry Vyukov) and released in 2011 [2][7], that is part of the LLVM compiler infrastructure. It performs compile-time instrumentation and uses a runtime library that replaces memory management functions such as malloc and free with custom code. With these properties, while fuzzing with AFL, you increase the likelihood of finding memory corruption errors such as heap buffer overflow, memory leaks, user -after-free and others [1]. The ASAN custom code that replaces the memory management functions use a shadow memory technique that keeps track of all the malloc-ed and free-ed regions and marks the areas of memory around it as red zones, i.e. it poisons the memory regions surrounding the malloc-ed and free-ed regions [4]. Then while fuzzing, if the input causes some sort out-of-bounds read or write, ASAN would catch that.
So, to use AFL with ASAN, instead of using afl-gcc compiler wrapper, like I did in previous article, I need to use the afl-clang-fast compiler which is a wrapper for Clang compiler. Noteworthy, if you are not leveraging ASAN, you should use the AFL Clang compiler because it is much faster than the AFL GCC compiler.
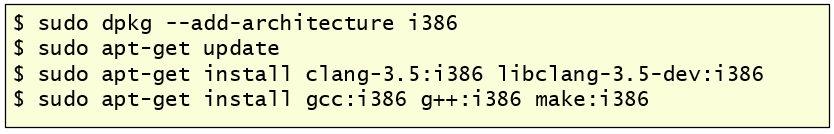
So, let’s start. First, I start by installing all dependencies for the 32-bit architecture. This step works well on a freshly installed 64-bit system, on an existing system you might need to resolve some dependencies between the different architectures.
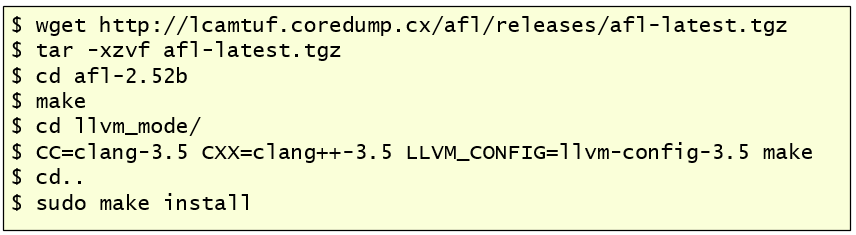
Then, like in the previous article, I’m going to download AFL and compile it, but this time I also need to compile the LLVM mode support and give it the correct flags and version of Clang.
Next, to compile the 32-bit version of tcpdump, I also need to compile the 32-bit version of libpcap. At the time of this writing the last version is 1.8.1. When compiling libpcap I use the “-m32” flag so it produces 32-bits code. When compiling tcpdump, I add the ASAN flags “-fsanitize=address” and “-fno-omit-frame-pointer” to add the AddressSanitizer run-time library and get better stack traces reports, respectively [3].
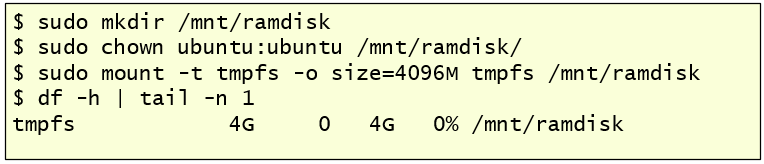
After that, I’m going to use the same corpus as the one outlined in the previous article and will put the corpus into a ramdisk. This is not a mandatory step but rather a good practice due to the fact that fuzzing is I/O intensive and could, eventually, reduce the lifetime of your hard drive specially with SSD’s.
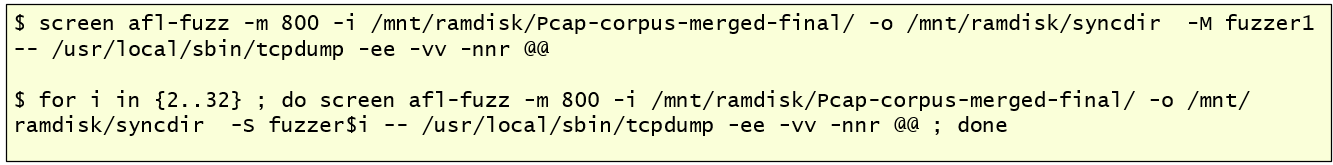
Then, start fuzzing! When you start AFL for the first time, you might want to start it without screen, to make sure it executes properly because AFL might printout instructions about tuning that needs to be performed on the operating system such as checking core_pattern and the CPU scaling governor. After having the master node running, I start the slave nodes. In this case I’m using a system with 32 cores, so I should be able to run 32 instances of AFL.
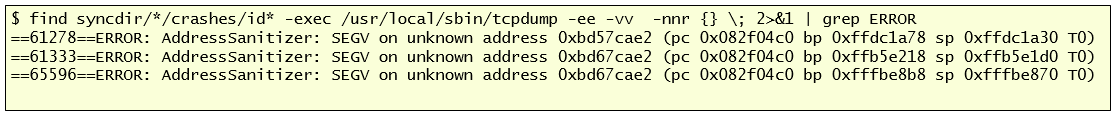
AFL will start reading the different test cases from the input directory, and fuzz them using the different deterministic and non-deterministic stages, find new test cases and queue them for future stage rounds. To check the status of the fuzzing session across the different, I could use afl-whatsup. After a while, you should, hopefully, start to see crashes on some of the fuzzer instances. Then you might want to start looking at the crashes across the different fuzzing sessions. Picture below illustrates a quick way to run the crash reports and grep for the ERROR line.
To get more information about were the crash happened and the stack trace, you could tell ASAN to output debug symbols information by using the options “ASAN_OPTIONS=symbolize=1” and “ASAN_SYMBOLIZER_PATH=/usr/bin/llvm-symbolizer-3.5”. In the picture below I run the crash files with ASAN options so I could see symbols.

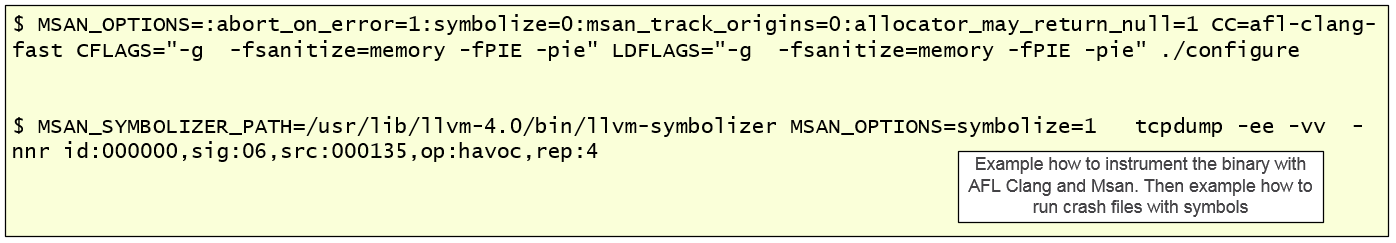
Before I continue, it is worth to mention that apart of running AFL with ASAN you could instead instrument the binary with MemorySanitizer (MSan). MSan is another address sanitizer that helps detect uninitialized memory reads in C/C++ programs which occur when a program tries to read allocated memory before it is written. For sake of brevity I’m only showing how to instrument tcpdump with MSAN and run a crash file report with symbolized stack trace for debugging purposes. MSAN needs a newer version of LLVM compiler infrastructure.
So, after you find a crash condition, what are the next steps? You report the bug to the vendor, maintainer or entity and provide them all the details. Then, they might work with you to find the root cause and finally they fix the code for the greater good of overall security. However, another path, instead of just reporting the fault, is finding the exploitability of a crash condition. This is another important aspect of the vulnerability analysis process, and nowadays the economical and professional incentives to perform this work are significant. However, in my opinion, this path is much harder. With the race between bugs being found and security measures being adopted by the different operating systems, the depth of knowledge that one needs in order to be able to triage the crash, likely produced by a fuzzer, debug the program, perform code analysis, understand its internals, assess its state when it crashes and determine if is there is any chance of exploitability under the operating system environment where crash occurred, is a remarkable and unique skill to have.
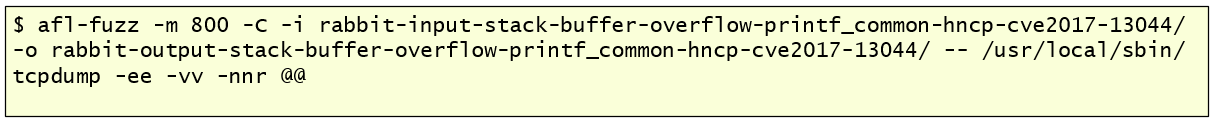
However, even if you are not the one to have those kind of skills, like myself, you could at least start to understand if by controlling the input allows you to have different outcomes. For example, are you able to, somehow, control the value on the memory address that causes a segmentation fault? AFL can help determine this to some degree. With AFL you can use one crash file and use the “crash exploration” mode which is also known as the “peruvian were-rabbit” mode. Essentially you feed AFL with the test case that causes a crash condition and AFL will quickly determine the different code paths that can be reached while maintain the crash state. With this AFL will generate a number of crash files that could help you understand to which degree the input has control over the fault address.
In this case, for illustration purposes, I executed AFL in crash exploration mode using as input the file “stack-buffer-overflow-printf_common-hncp-cve2017-13044.pcap”. This is a packet capture that triggers CVE-2017-13044 : HNCP parser in tcpdump before 4.9.2 has a buffer over-read in print-hncp.c:dhcpv4_print(). After a few minutes, AFL was able to determine 42 unique crashes. This means 42 unique code paths that lead to the same crash state.

Quickly looking at the ASAN reports we can obtain two crashes that overrun the buffer boundary and allow us to READ different sizes of adjacent memory.

Picture below shows the ASAN stack trace report with Symbols when running the packet capture that triggers the CVE-2017-13044 on tcpdump version 4.9.0.

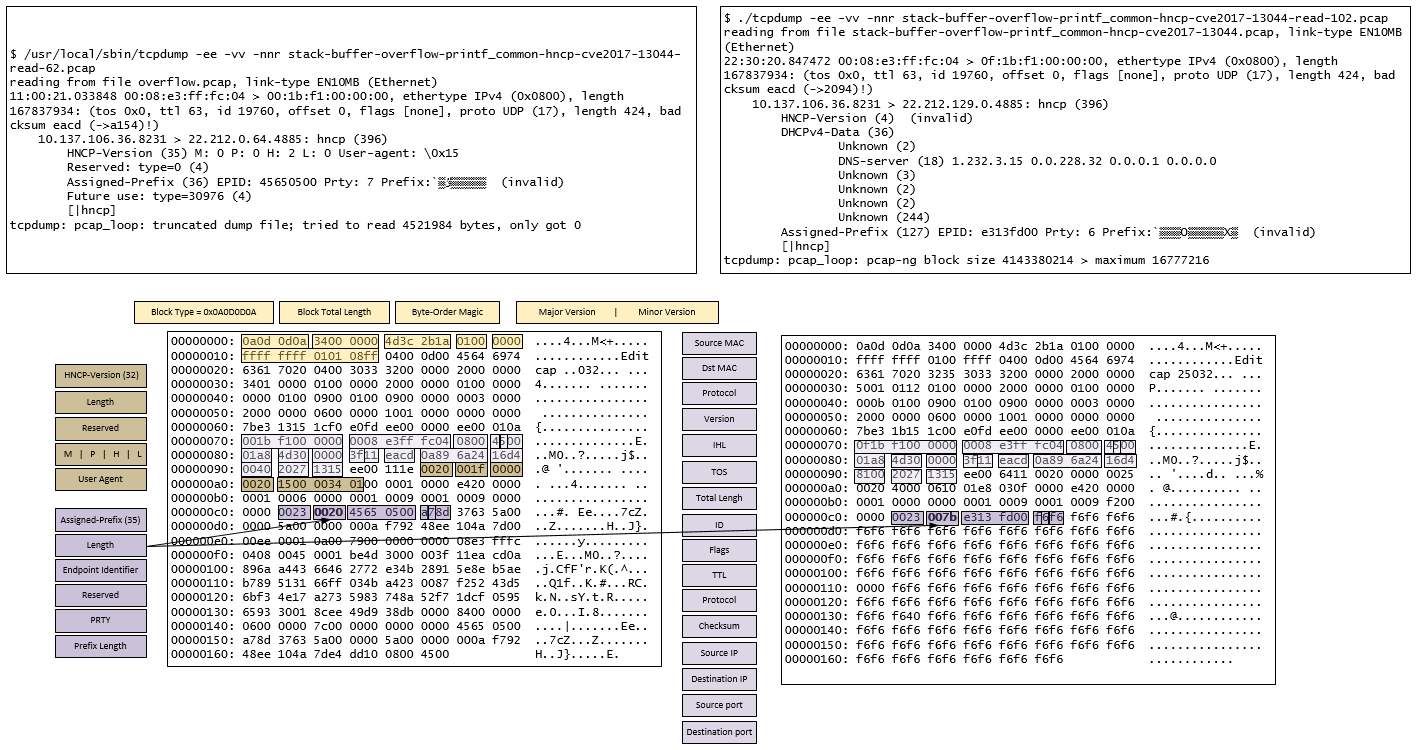
So, after that, in an attempt to understand more, you could identify the function and look at the tcpdump source code and also start to debug it with a debugger. Other than that I wanted to understand if by changing a particular byte in the input file I could control something. Therefore I mapped the packet capture to the protocol in question (HNCP) which is described in RFC7788. After some trial and error, it seems there are a 2-bytes in the “Prefix Length” field that cause the buffer over read condition. The picture below shows the hex listing and mapping for the two crash conditions related to CVE-2017-13044. On the packet from the left, setting the HNCP “Prefix Length” on any value between 0x1f and 0x98 will make the ndo_printf() print stack contents. Other values don’t produce the leak. On the packet from the right, the range is from 0x25 to 0x98. So, I could see that I could leak at least 2 memory addresses from the stack but I couldn’t not find a way to control what is printed. Nonetheless, perhaps this packet capture could be merged with another one that has another bug that allows you to control, somehow, the saved return pointer and use the leak to bypass ASLR.
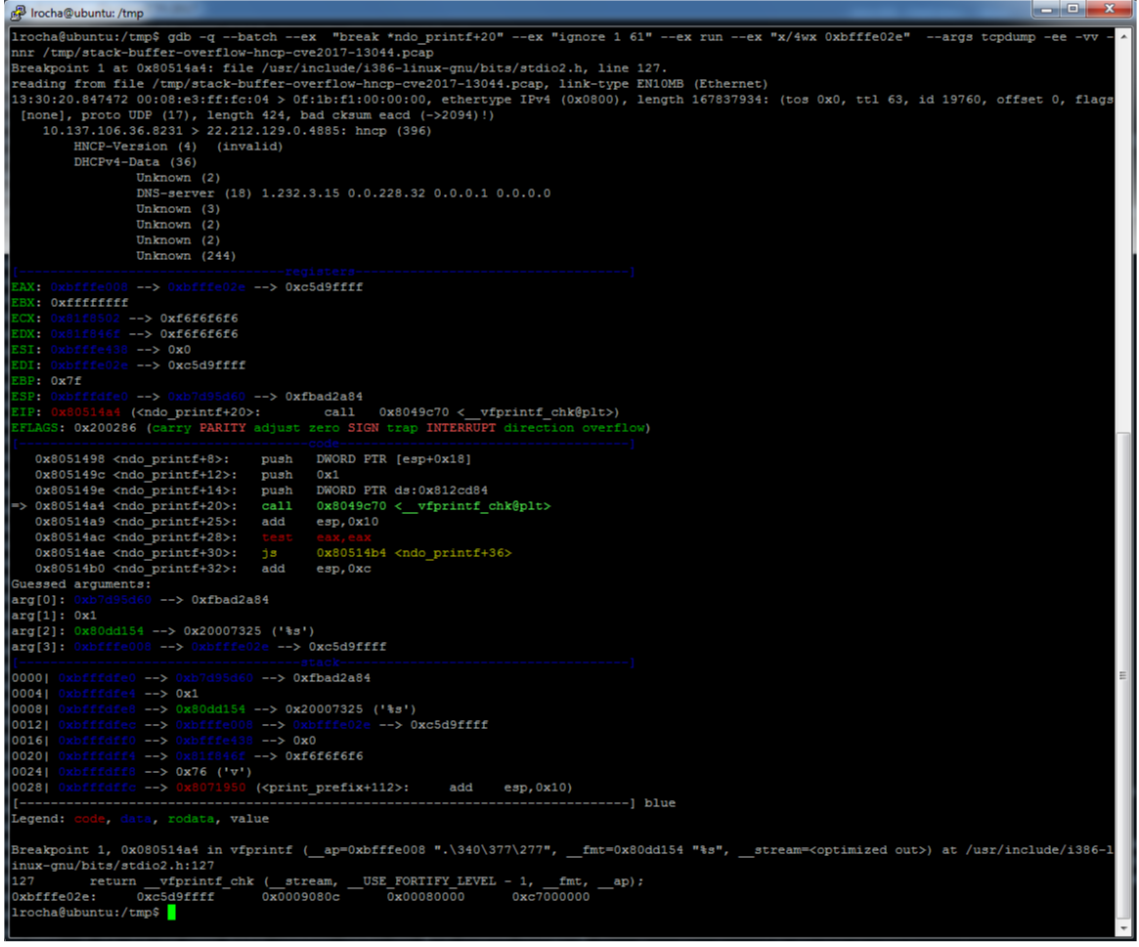
The printscreen below shows the output of GDB (with PEDA plugin) when setting a breakpoint on the function responsible to print the fault address. The debugging session was done with tcpdump compiled without ASAN. Noteworthy if the program is compiled with ASAN and you want to load it into GDB and view the program state before the ASAN crash report you could set a break point on “__asan_report_error”.
That’s it for today. this was the second episode about American Fuzzy Lop. I presented a small step-by-step guide on how you could start using AFL with the LLVM compiler infrastructure. Plus, among other things, leverage the address sanitizers such as ASAN or MSAN to fuzz an open source target and catch a bigger variety of bugs related to memory corruption. In addition, we started to look at the crashes and with small steps understand if it was exploitable.
Using the various techniques described in this article, during the last weeks, I fuzzed couple of tools (tcpdump, affutils, libevt and sleuthkit) and found some faults that I reported to the respective maintainers. I will update the below list as soon as all the faults are disclosed and acknowledged.
- CVE-2018-8050 : The af_get_page() function in lib/afflib_pages.cpp in AFFLIB (aka AFFLIBv3) through 3.7.16 allows remote attackers to cause a denial of service (segmentation fault) via a corrupt AFF image that triggers an unexpected pagesize value. I reported this bug to Phillip Hellewell who promptly analyzed the crash condition and quickly released a fix for it.
- CVE-2018-8754 : The libevt_record_values_read_event() function in libevt_record_values.c in libevt before 2018-03-17 does not properly check for out-of-bounds values of user SID data size, strings size, or data size. I reported this bug to Joachim Metz who promptly analyzed the crash condition and quickly released a fix for it.
Credits: Thanks to Aleksey Cherepanov for his enthusiasm, valued support and willingness to help me with my never ending questions and Rui Reis for his ideas and support to make this article better.
References:
[1] https://github.com/google/sanitizers/wiki/AddressSanitizer
[2] https://blog.chromium.org/2011/06/testing-chromium-addresssanitizer-fast.html
[3] https://clang.llvm.org/docs/AddressSanitizer.html
[4] http://devstreaming.apple.com/videos/wwdc/2015/413eflf3lrh1tyo/413/413_advanced_debugging_and_the_address_sanitizer.pdf (page 29)
[5] https://www.blackhat.com/docs/us-16/materials/us-16-Branco-DPTrace-Dual-Purpose-Trace-For-Exploitability-Analysis-Of-Program-Crashes-wp.pdf
[6] https://github.com/google/sanitizers/wiki/MemorySanitizer
[7] https://www.usenix.org/system/files/conference/atc12/atc12-final39.pdf
Vulnerability Discovery and Triage Automation training material from Richard Johnson
