
[Editor’s Note: My wife has been complaining about her laptop running slow for quite some time. I am not sure if the system is really slow due to its specifications or the number of pictures it has : ) . But then I thought – This is a good opportunity to try Redline from Mandiant, wear my Sherlock Holmes hat and maybe I find something interesting -. Below are the steps taken to do a live memory acquisition using Redline and its comprehensive agent collector for in depth malware hunting! ~Luis ]
Following the identification phase of the incident handling process, where among others you have identified malicious acts or deviations from the normal operation. It comes the containment phase. This is the third stage of responding to computer incidents. Trough this step, one of the things we do is a initial analysis of the compromised system by taking a low profile approach. Is also where we capture the relevant data from the system – in forensics terms this step is where you preserve digital evidence.. Normally we would do a forensics image of the affected system for further analysis. One thing that should be part of our forensics image is the file system (disk imaging) and a memory dump (volatile data). One of tools that can help incident handlers looking at the memory/volatile data for further forensics analysis is The Volatility Framework and associated plug-ins. Another powerful one is Memoryze from Mandiant. Memoryze version 3.0 was released last July and it supports a variety of operating systems. From the time Memoryze was released, Audit Viewer was the tool of choice to interpret and visualize its output. These two tools have evolved and are blended in Mandiant Redline. Last December, Redline 1.11 was released with support from Windows 8 and 2012. “Redline is a free utility that accelerates the process of triaging hosts suspected of being compromised or infected while supporting in-depth live memory analysis.“. In addition this tool can also help you finding malware trough the use if Indicators of Compromise (IOC) which is a very powerful method and can be used to find threats at host or network level.
To execute Redline and to do the live system memory acquisition, the methodology used is the one suggested in the user guide. It’s very straight forward and consists on the following 6 steps:
We went through the user guide and according to Mandiant you should install Redline in a pristine system. Mandiant recommends this approach due to inability to assure that your system is secure and free from malware. This way you would ensure the results and the IOC database is not compromised. Further, you don’t create the risk to overwrite or destruct evidence from disk or memory. Mandiant even recommends to run the Redline in a system fully disconnected from the network. That being said, I fire up my VMware workstation and installed a new Windows 7 32bit system.
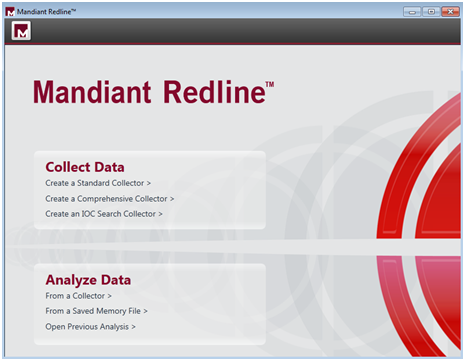
We didn’t fully disconnect the system from the network. We did position it in the Bridge VMnet in order to have access to our home network and be able to access internet to download stuff. We downloaded the tool and ran it. First thing it will say is that Redline requires Microsoft .NET 4. If is not installed it will redirect to the Microsoft .NET installation web page. The installation is quick and simple. Just follow the user guide. When the installation is finished you will be presented a nice web interface like shown below.
After glimpsing trough the user guide and getting acquainted, Redline has ways that it calls Collectors to acquire data from the suspicious system. The Standard Collector, Comprehensive Collector and IOC Search collector and the 3 methods supported. We decided to run the Comprehensive Collector to gather the most data out of the system for a full in depth analysis. Each one of the methods is well explained in the user guide.
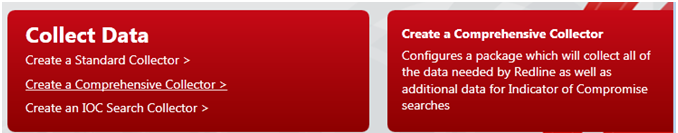
In addition, we further selected to acquire a memory image which is not selected by default. We left the remaining options regarding memory, disk, system and network untouched. We selected a folder and saved the collector settings.

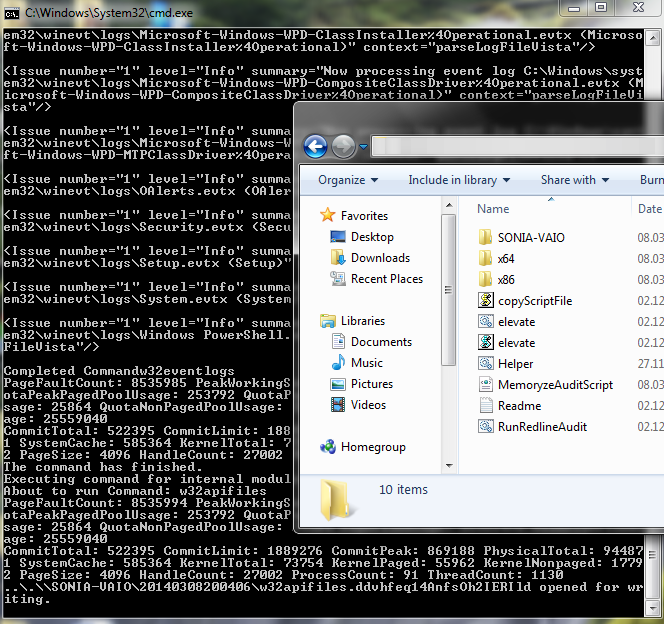
We then copied the collector folder into a USB stick. Then we went with the USB stick into my wife computer and launched the “RunRedlineAudit.bat” script. This script will go through the Collector settings we defined and will acquire all the data and save the results into a folder with the computer hostname name. It took around 3 hours to acquire all the data – the system had 4 GB of Ram and a slow disk –
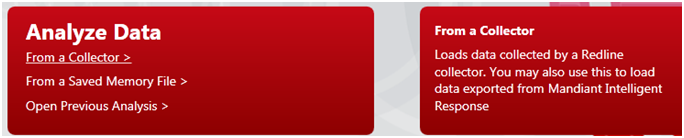
We then moved the USB stick back into the Redline system and used the Analyze Data option from the main menu. Then selected From Collector which allows you to load the data into Redline.
We selected the folder location of the data and at this stage you can also compare the data with IOC artifacts of your choice. At this stage we will skip the IOCs.
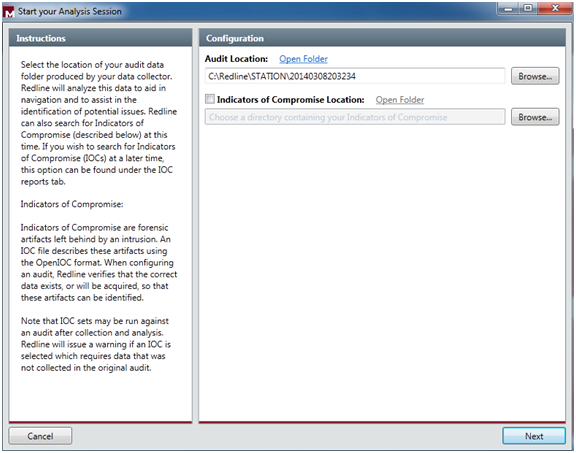
Then click next and you select the name for saving your analysis session. It then starts loading all the data and creating the analysis session.
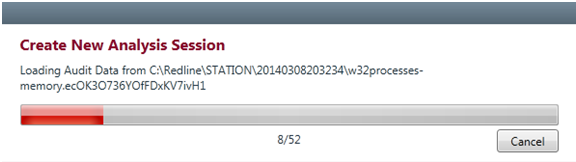
After finishing loading the data we are presented with a nice “Start your Investigation” page. This is the home page of your analysis and it contains several steps suggested by the tool to assist in your investigation:
- I am Reviewing a Triage collection from MSO.
- I am Investigating a Host Based on a External Investigative Lead.
- I am Reviewing a Full Live Response or Memory Image.
- I am Reviewing Web History Data.
- I Want to search my data with a set of Indicators of Compromise.
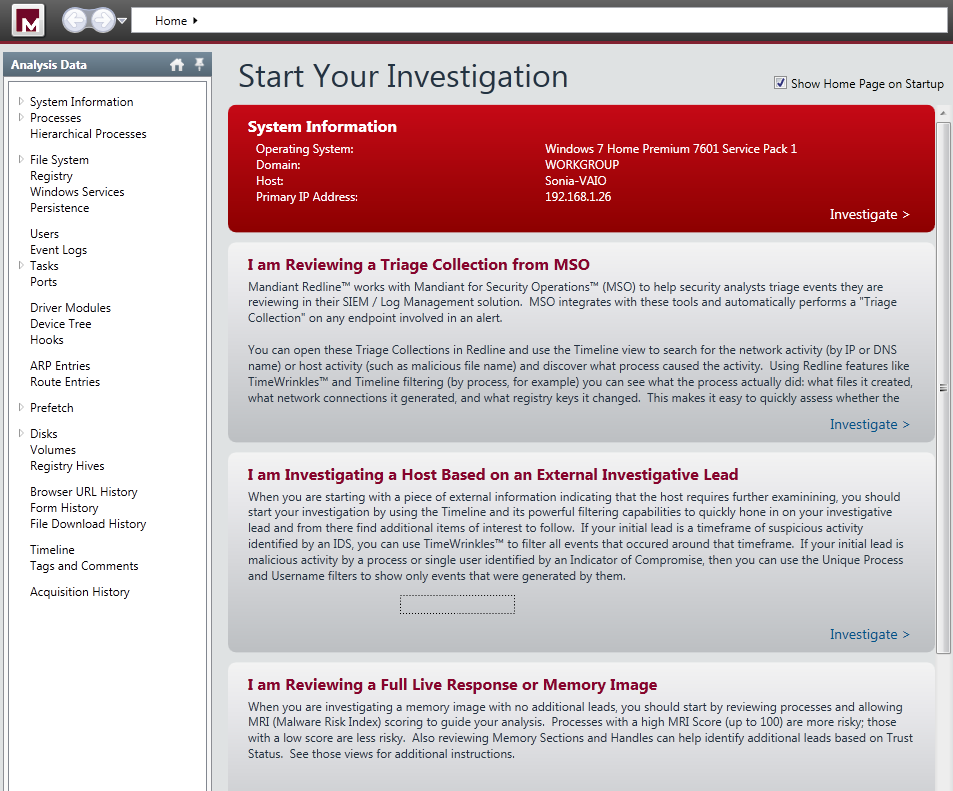
We will go trough the Investigation Steps in another post. But, It is impressive to see the how easily you can capture a enormous amount of information in an automated fashion. The tool capture the entire file-system structure, the network state, the system memory, the contents of the registry, processes information, event logs, web browser history, service information, etc. The interface is also well designed and provides an interesting workflow (collect, import, investigate) that presents suggested investigative steps that you should take in order to examine the data and look for signs of Evil.
As you could see this part is the boring part (collecting and importing). The interesting part (investigation) is to start to get familiar with these live system captures collected from a variety of good an evil systems. Which then allows you to get a sense of what to look and start your investigations and look for threats. This will require practice. Practice these kind of skills, share your experiences, get feedback, repeat the practice, and improve until you are satisfied with your performance.

So where is the link to part 2?
LikeLike
Here you have : https://countuponsecurity.com/2014/04/07/finding-evil-on-my-wifes-laptop-part-ii/
LikeLike
Hi, i followed your guide and launched the “RunRedlineAudit.bat” script.
As a result, i got back “Ensuring the proper working directory “.\x64\xagt.exe” -o “E:\RedlineCollector\\Sessions\AnalysisSession4\Audits” -f “MemoryzeAusditScript.xml”
and short after, the cmd windows shut off automatically.
Can you please kindly advise me? Thank you.
LikeLike