Malware Analysis – PlugX

[The PlugX malware family has always intrigued me. I was curious to look at one variant. Going over the Internet and the research articles and blogs about it I came across the research made by Fabien Perigaud. From here I got an old PlugX builder. Then I set a lab that allowed me to get insight about how an attacker would operate a PlugX campaign. In this post, l will cover a brief overview about the PlugX builder, analyze and debug the malware installation and do a quick look at the C2 traffic. ~LR]

PlugX is commonly used by different threat groups on targeted attacks. PlugX is also refered as KORPLUG, SOGU, DestroyRAT and is a modular backdoor that is designed to rely on the execution of signed and legitimated executables to load malicious code. PlugX, normally has three main components, a DLL, an encrypted binary file and a legitimate and signed executable that is used to load the malware using a technique known as DLL search order hijacking. But let’s start with a quick overview about the builder.

The patched builder, MD5 6aad032a084de893b0e8184c17f0376a, is an English version, from Q3 2013,  of the featured-rich and modular command & control interface for PlugX that allows an operator to:

  • Build payloads, set campaigns and define the preferred method for the compromised hosts to check-in and communicate with the controller.
  • Proxy connections and build a tiered C2 communication model.
  • Define persistence mechanisms and its attributes.
  • Set the process(s) to be injected with the payload.
  • Define a schedule for the C2 call backs.
  • Enable keylogging and screen capture.
  • Manage compromises systems per campaign.

Then for each compromised system, the operator has extensive capabilities to interact with the systems over the controller that includes the following modules:

  • Disk module allows the operator to write, read, upload, download and execute files.
  • Networking browser module allows the operator to browse network connections and connect to another system via SMB.
  • Process module to enumerate, kill and list loaded modules per process.
  • Services module allows the operator to enumerate, start, stop and changing booting properties
  • Registry module allows the operator to browse the registry and create, delete or modify keys.
  • Netstat module allows the operator to enumerate TCP and UDP network connections and the associated processes
  • Capture module allows the operator to perform screen captures
  • Control plugin allows the operator to view or remote control the compromised system in a similar way like VNC.
  • Shell module allows the operator to get a command line shell on the compromised system.
  • PortMap module allows the operator to establish port forwarding rules.
  • SQL module allows the operator to connect to SQL servers and execute SQL statements.
  • Option module allows the operator to shut down, reboot, lock, log-off or send message boxes.
  • Keylogger module captures keystrokes per process including window titles.

The picture below shows the Plug-X C2 interface.

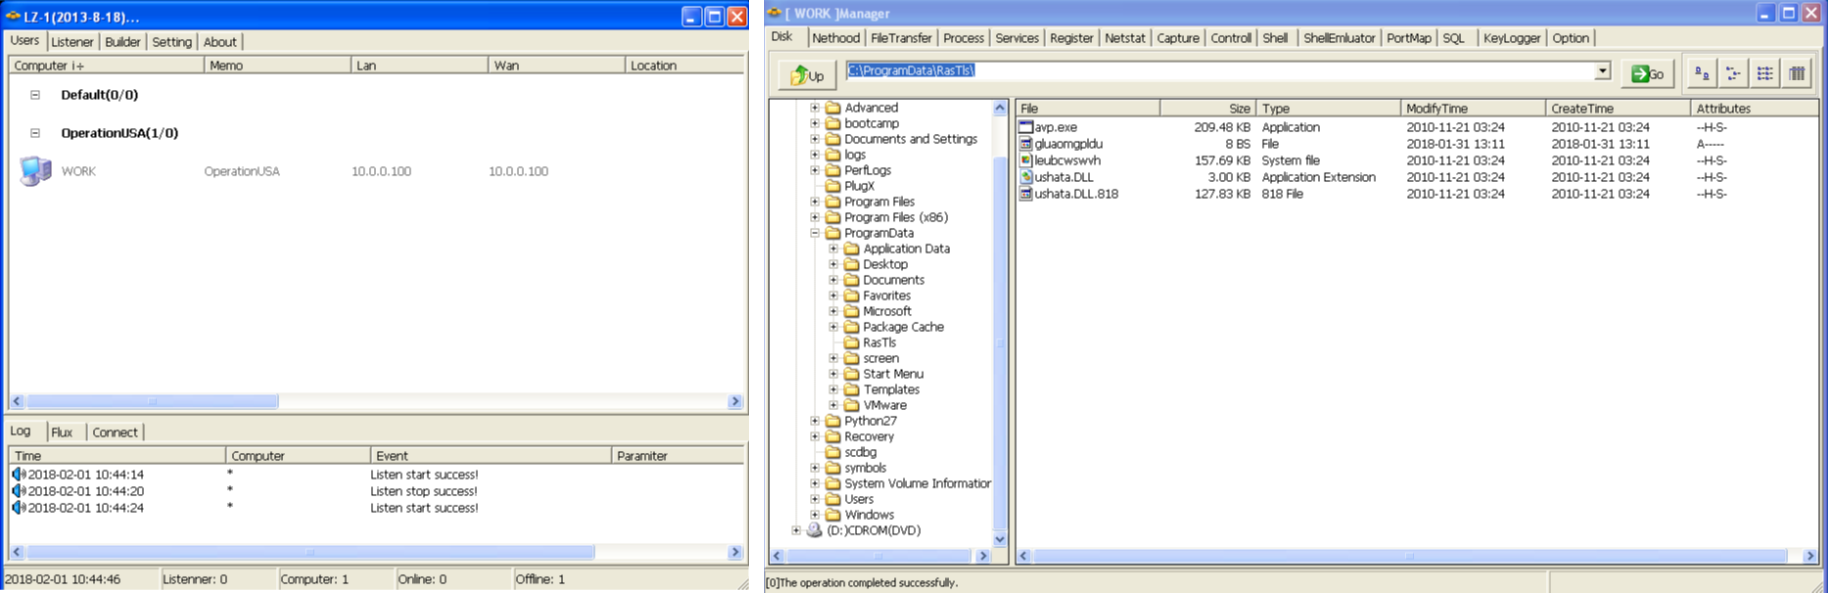
So, with this we used the builder functionality to define the different settings specifying C2 comms password, campaign, mutex, IP addresses, installation properties, injected binaries, schedule for call-back, etc. Then we build our payload. The PlugX binary produced by this version of the builder (LZ 2013-8-18) is a self-extracting RAR archive that contains three files. This is sometimes referred in the literature as the PlugX trinity payload. Executing the self-extracting RAR archive will drop the three files to the directory chosen during the process. In this case “%AUTO%/RasTls”. The files are: A legitimate signed executable from Kaspersky AV solution named “avp.exe”, MD5 e26d04cecd6c7c71cfbb3f335875bc31, which is susceptible to DLL search order hijacking . The file “avp.exe” when executed will load the second file: “ushata.dll”, MD5 728fe666b673c781f5a018490a7a412a, which in this case is a DLL crafted by the PlugX builder which on is turn will load the third file. The third file: “ushata.DLL.818”, MD5 “21078990300b4cdb6149dbd95dff146f” contains obfuscated and packed shellcode.

So, let’s look at the mechanics of what happens when the self-extracting archive is executed. The three files are extracted to a temporary directory and “avp.exe” is executed. The “avp.exe” when executed will load “ushata.dll” from the running directory due to the DLL search order hijacking using Kernel32.LoadLibrary API.

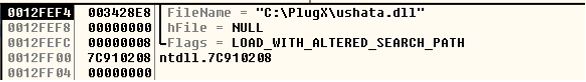
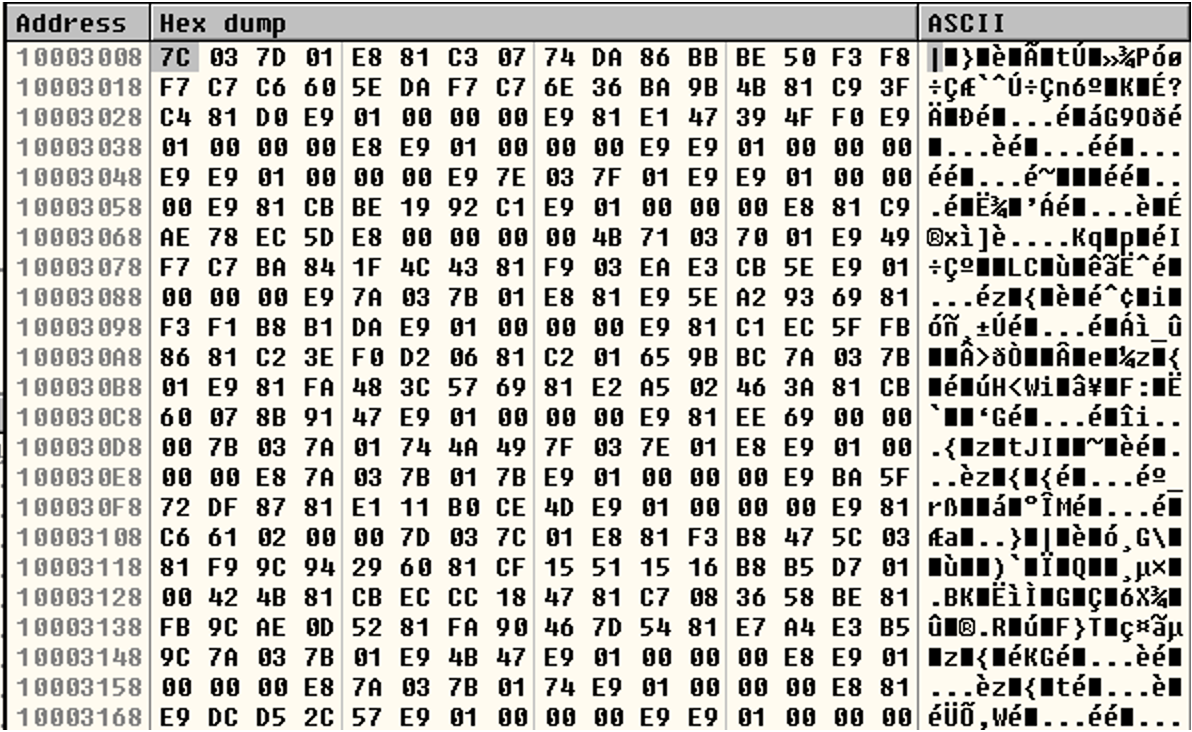
Then “ushata.dll” DLL entry point is executed. The DLL entry point contains code that verifies if the system date is equal or higher than 20130808. If yes it will get a handle to “ushata.DLL.818”, reads its contents into memory and changes the memory address segment permissions to RWX using Kernel32.VirtualProtect API. Finally, returns to the first instruction of the loaded file (shellcode). The file “ushata.DLL.818” contains obfuscated shellcode. The picture below shows the beginning of the obfuscated shellcode.

The shellcode unpacks itself using a custom algorithm. This shellcode contains position independent code. Figure below shows the unpacked shellcode.

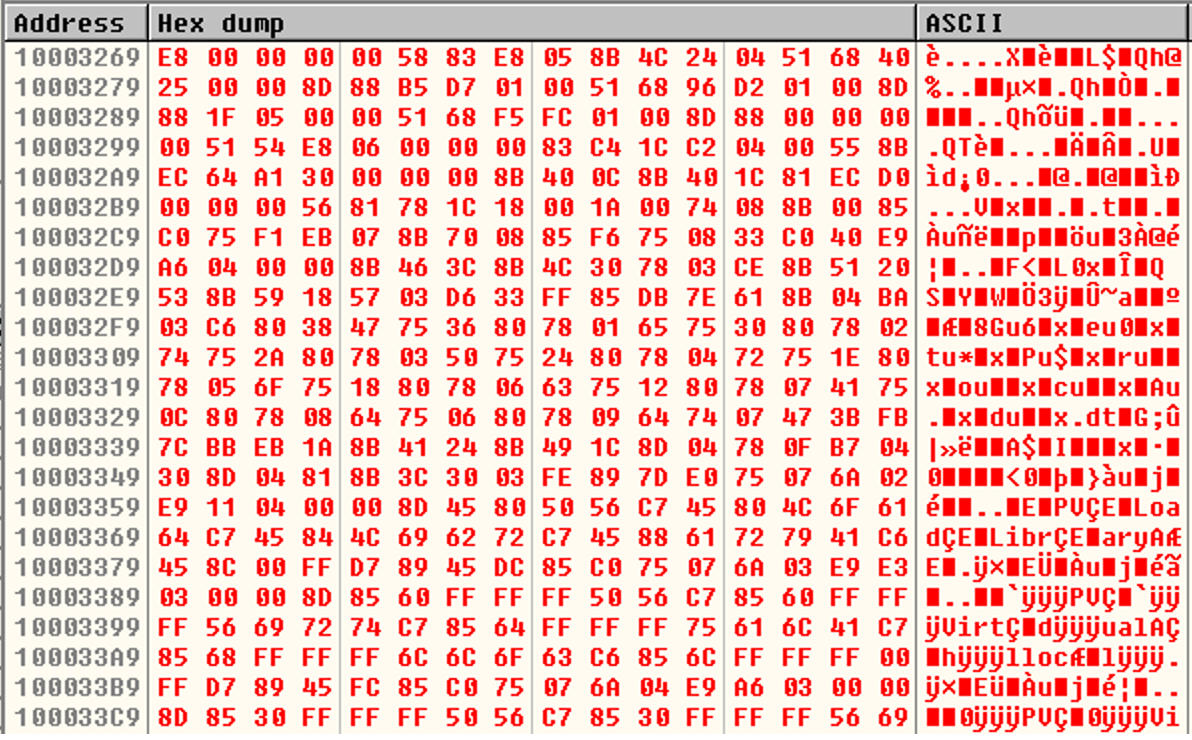
The shellcode starts by locating the kernel32.dll address by accessing the Thread Information Block (TIB) that contains a pointer to the Process Environment Block (PEB) structure. Figure below shows a snippet of the shellcode that contains the different sequence of assembly instructions for the code to find the Kernel32.dll.

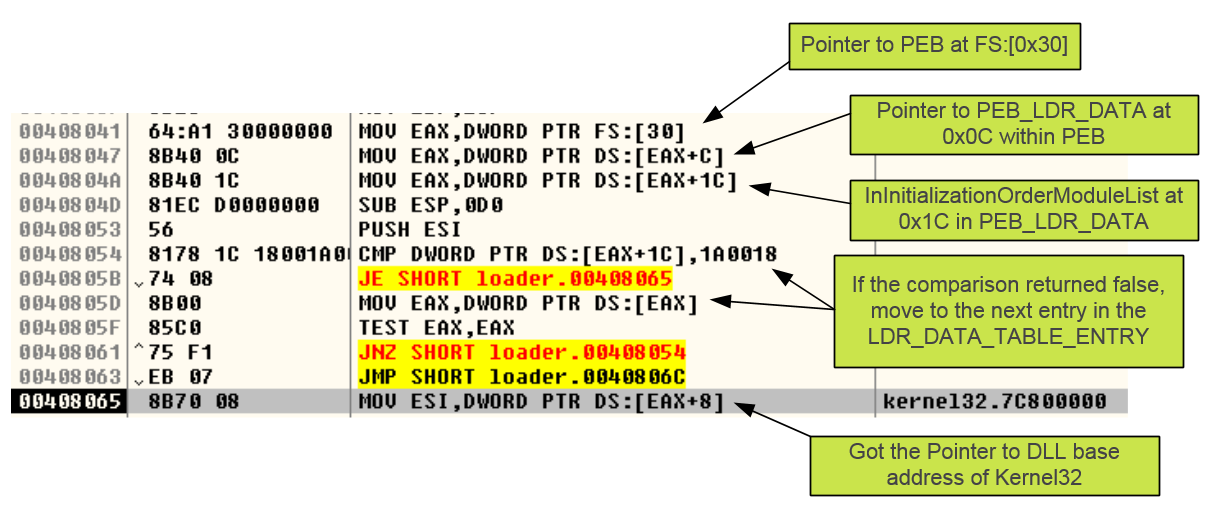
It then reads kernel32.dll export table to locate the desired Windows API’s by comparing them with stacked strings. Then, the shellcode decompresses a DLL (offset 0x784) MD5 333e2767c8e575fbbb1c47147b9f9643, into memory using the LZNT1 algorithm by leveraging ntdll.dll.RtlDecompressBuffer API. The DLL contains the PE header replaced with the “XV” value. Restoring the PE header signature allows us to recover the malicious DLL.

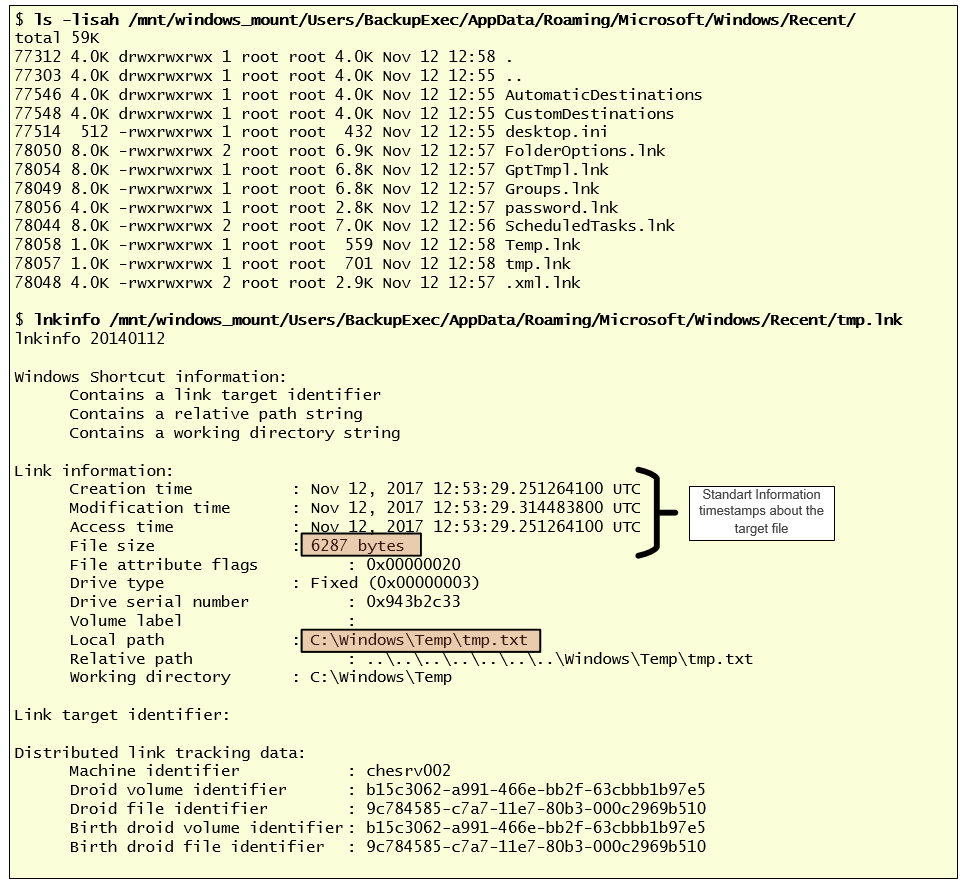
Next, the payload will start performing different actions to achieve persistence. On Windows 7 and beyond, PlugX creates a folder “%ProgramData%\RasTl” where “RasTl” matches the installation settings defined in the builder. Then, it changes the folder attributes to “SYSTEM|HIDDEN” using the SetFileAttributesW API. Next, copies its three components into the folder and sets all files with the “SYSTEM|HIDDEN” attribute.

The payload also modifies the timestamps of the created directory and files with the timestamps obtained from ntdll.dll using the SetFileTime API.

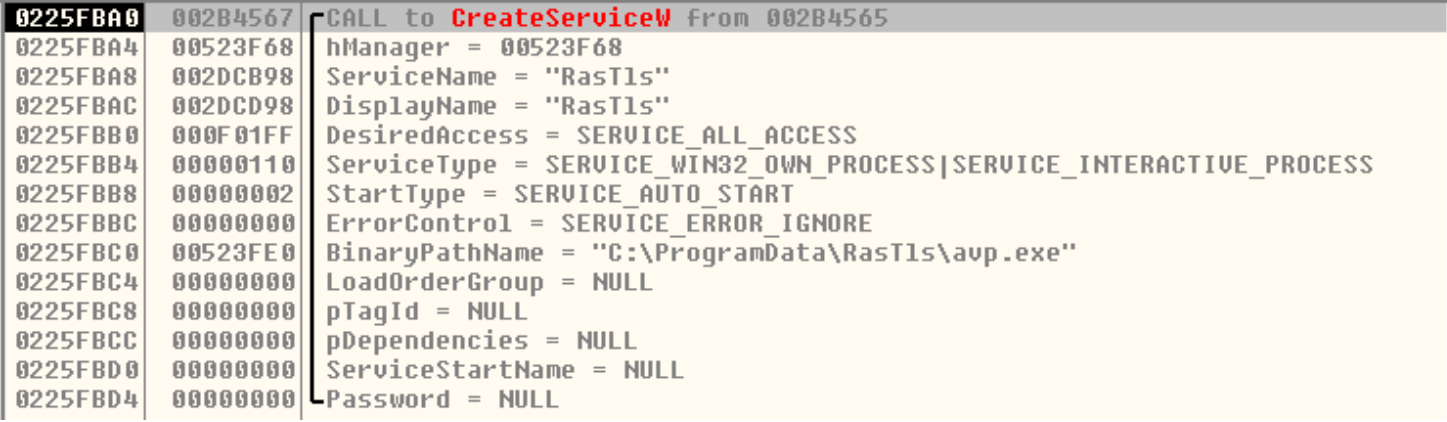
Then it creates the service “RasTl” where the ImagePath points to “%ProgramData%\RasTl\avp.exe”

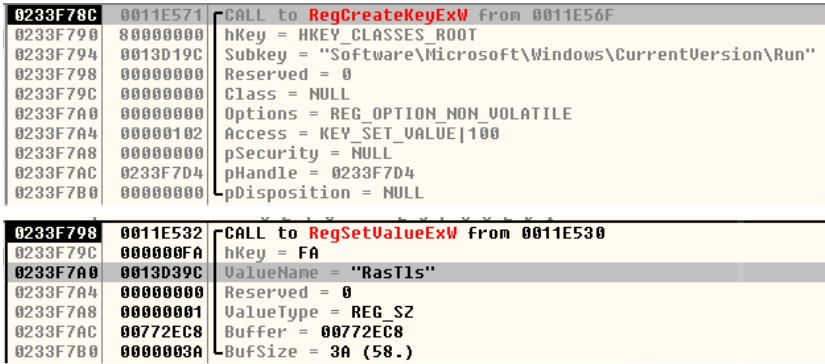
If the malware fails to start the just installed service, it will delete it and then it will create a persistence mechanism in the registry by setting the registry value “C:\ProgramData\RasTls\avp.exe” to the key “HKLM\SOFTWARE\Classes\SOFTWARE\Microsoft\Windows\CurrentVersion\Run\RasTls” using the RegSetValueExW API.

If the builder options had the Keylogger functionality enabled, then it may create a file with a random name such as “%ProgramData%\RasTl\rjowfhxnzmdknsixtx” that stores the key strokes. If the payload has been built with Screen capture functionality, it may create the folder “%ProgramData%\RasTl \RasTl\Screen” to store JPG images in the format <datetime>.jpg that are taken at the frequency specified during the build process. The payload may also create the file “%ProgramData%\DEBUG.LOG” that contains debugging information about its execution (also interesting that during execution the malware outputs debug messages about what is happening using the OutputDebugString API. This messages could be viewed with DebugView from SysInternals). The malicious code completes its mission by starting a new instance of “svchost.exe” and then injects the malicious code into svchost.exe process address space using process hollowing technique. The pictures below shows the first step of the process hollowing technique where the payload creates a new “svchost.exe” instance in SUSPENDED state.

and then uses WriteProcessMemory API to inject the malicious payload

Then the main thread, which is still in suspended state, is changed in order to point to the entry point of the new image base using the SetThreadContext API. Finally, the ResumeThread API is invoked and the malicious code starts executing. The malware also has the capabilities to bypass User Account Control (UAC) if needed. From this moment onward, the control is passed over “svchost.exe” and Plug-X starts doing its thing. In this case we have the builder so we know the settings which were defined during building process. However, we would like to understand how could we extract the configuration settings. During Black Hat 2014, Takahiro Haruyama and Hiroshi Suzuki gave a presentation titled “I know You Want Me – Unplugging PlugX” where the authors go to great length analyzing a variety of PlugX samples, its evolution and categorizing them into threat groups. But better is that the Takahiro released a set of PlugX parsers for the different types of PlugX samples i.e, Type I, Type II and Type III. How can we use this parser? The one we are dealing in this article is considered a PlugX type II. To dump the configuration, we need to use Immunity Debugger and use the Python API. We need to place the “plugx_dumper.py” file into the “PyCommands” folder inside Immunity Debugger installation path. Then attached the debugger to the infected process e.g, “svchost.exe” and run the plugin. The plugin will dump the configuration settings and will also extract the decompressed DLL

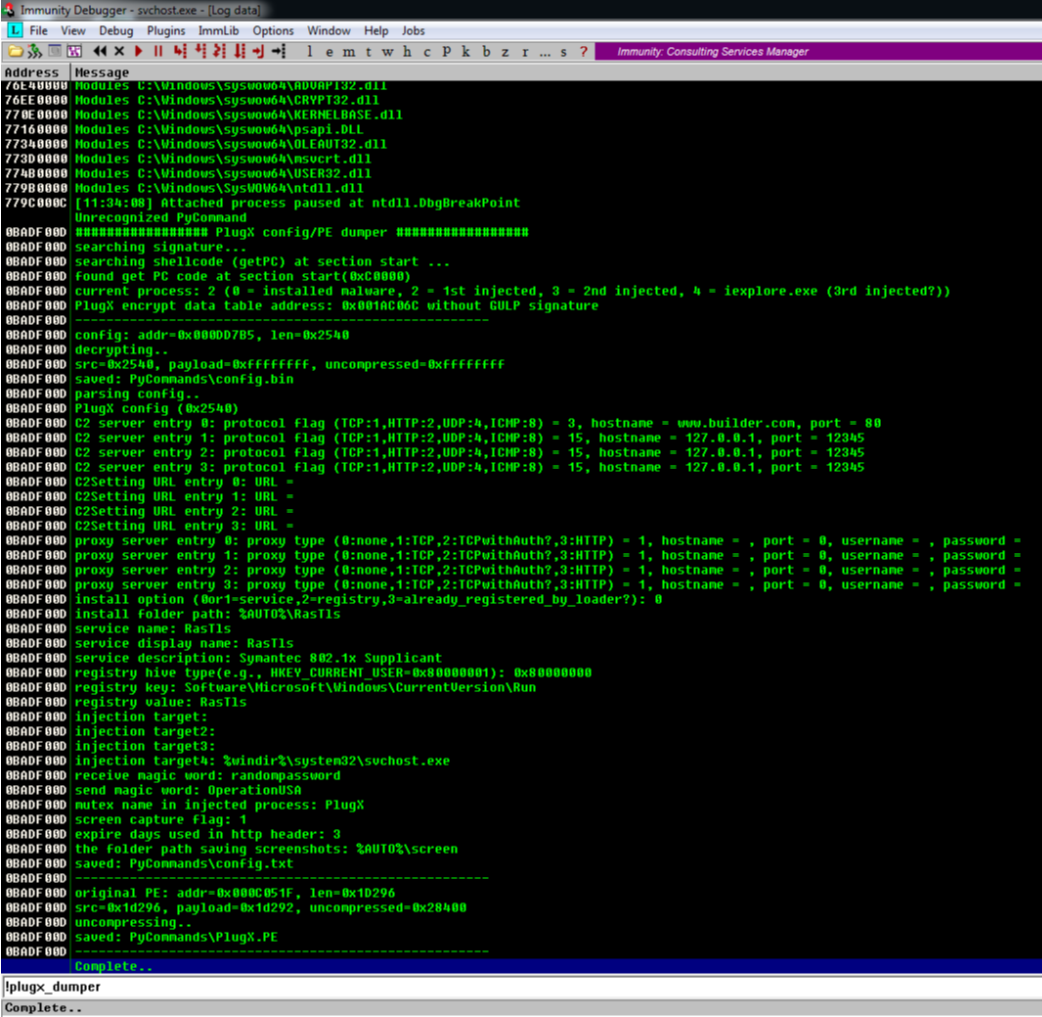
We can see that this parser is able to find the injected shellcode, decode its configuration and all the settings an attacker would set on the builder and also dump the injected DLL which contains the core functionality of the malware.

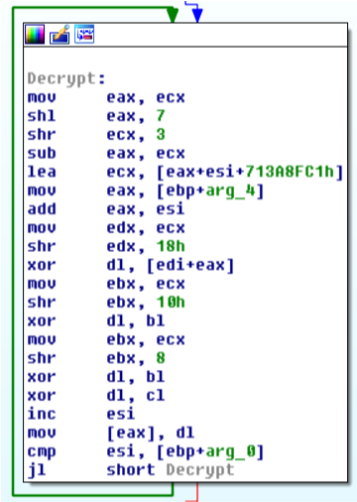
In terms of networking, as observed in the PlugX controller, the malware can be configured to speak with a controller using several network protocols. In this case we configured it to speak using HTTP on port 80. The network traffic contains a 16-byte header followed by a payload. The header is encoded with a custom routine and the payload is encoded and compressed with LZNT1. Far from a comprehensive analysis we launched a Shell prompt from the controller, typed command “ipconfig” and observed the network traffic. In parallel, we attached a debugger to “svchost.exe” and set breakpoints: on Ws2_32.dll!WSASend and Ws2_32.dll!WSARecv to capture the packets ; on ntdll.dll!RtlCompressBuffer and ntdll.dll!RtlDecompressBuffer to view the data before and after compression. ; On custom encoding routine to view the data before and after. The figure below shows a disassemble listing of the custom encoding routine.

So, from a debugger view, with the right breakpoints we could start to observe what is happening. In the picture below, on the left-hand side it shows the packet before encoding and compression. It contains a 16-byte header, where the first 4-bytes are the key for the custom encoding routine. The next 4-bytes are the flags which contain the commands/plugins being used. Then the next 4-bytes is the size. After the header there is the payload which in this case contains is output of the ipconfig.exe command. On the right-hand side, we have the packet after encoding and compressing. It contains the 16-byte header encoded following by the payload encoded and compressed.

Then, the malware uses WSASend API to send the traffic.

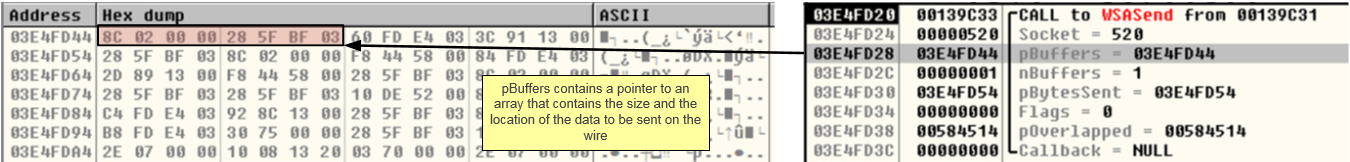
Capturing the traffic, we can observe the same data.

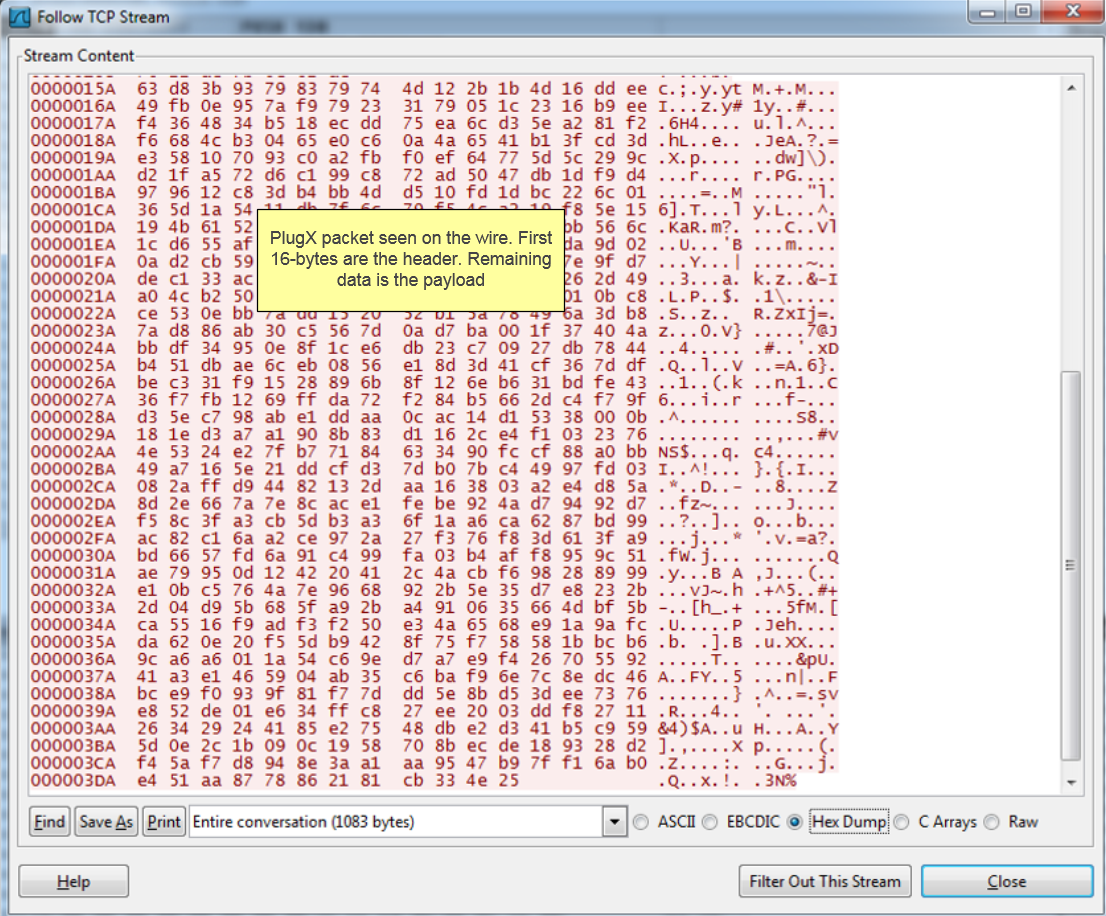
On the controller side, when the packet arrives, the header will be decoded and then the payload will be decoded and decompressed. Finally, the output is showed to the operator.

Now that we started to understand how C2 traffic is handled, we can capture it and decode it.  Kyle Creyts has created a PlugX decoder that supports PCAP’s. The decoder supports decryption of PlugX Type I.But Fabien Perigaud reversed the Type II algorithm and implemented it in python. If we combine Kyle’s work with the work from Takahiro Haruyama and Fabien Perigaud we could create a PCAP parser to extract PlugX Type II and Type III. Below illustrates a proof-of-concept for this exercise against 1 packet. We captured the traffic and then used a small python script to decrypt a packet. No dependencies on Windows because it uses the herrcore’s standalone LZNT1 implementation that is based on the one from the ChopShop protocol analysis and decoder framework by MITRE.

That’s it for today! We build a lab with a PlugX controller, got a view on its capabilities. Then we looked at the malware installation and debugged it in order to find and interpret some of its mechanics such as DLL search order hijacking, obfuscated shellcode, persistence mechanism and process hollowing. Then, we used a readily available parser to dump its configuration from memory. Finally, we briefly looked the way the malware communicates with the C2 and created a small script to decode the traffic. Now, with such environment ready, in a controlled and isolated lab, we can further simulate different tools and techniques and observe how an attacker would operate compromised systems. Then we can learn, practice at our own pace and look behind the scenes to better understand attack methods and ideally find and implement countermeasures.

References:
Analysis of a PlugX malware variant used for targeted attacks by CRCL.lu
Operation Cloud Hopper by PWC
PlugX Payload Extraction by Kevin O’Reilly
Other than the authors and articles cited troughout the article, a fantastic compilation about PlugX articles and papers since 2011 is available here.

Credits: Thanks to Michael Bailey who showed me new techniques on how to deal with shellcode which I will likely cover on a post soon.

Tagged , , , , ,

Digital Forensics – Artifacts of interactive sessions

In this article I would like to go over some of the digital forensic artifacts that are likely to be useful on your quest to find answers to investigative questions. Specially, when conducting digital forensics and incident response on security incidents that you know the attacker performed its actions while logged in interactively into a Microsoft Windows systems. Normally, one of the first things I look is the Windows Event logs. When properly configured they are a treasure trove of information, but in this article, I want to focus on artifacts that can be useful even if an attacker attempts to cover his tracks by deleting the Event Logs.

Let’s start with ShellBags!

To improve the customer experience, Microsoft operating systems stores folder settings in the registry. If you open a folder, resize its dimensions, close it and open it again, did you notice that Windows restored the view you had? Yep, that’s ShellBags in action. This information is stored in the user profile hive “NTUSER.dat” within the directory “C:\Users\%Username%\” and in the hive “UsrClass.dat” which is stored at “%LocalAppData%\Microsoft\Windows”. When a profile is loaded into the registry, both hives are mounted into the HKEY_USERS and then then linked to the root key HKEY_CURRENT_USER and HKEY_CURRENT_USER\Software\Classes respectively. If you are curious, you can see where the different files are loaded by looking at the registry key “HKEY_LOCAL_MACHINE\SYSTEM\CurrentControlSet\Control\hivelist”. On Windows XP and 2003 the ShellBags registry keys are stored at HKEY_USERS\{SID}\Software\​Microsoft\Windows\Shell\ and HKEY_USERS\{SID}\Software\​Microsoft\Windows\ShellNoRoam\.  On Windows 7 and beyond the ShellBags registry keys are stored at “HKEY_USERS\{SID}_Classes\​Local Settings\Software\​Microsoft\Windows\Shell\”.

Why are ShellBags relevant?

Well, this particular artifact allows us to get visibility about the intent or knowledge that a user or an attacker had when accessing or browsing directories and, when. Even if the directory does no longer exists. For example, an attacker that connects to a system using Remote Desktop and accesses a directory where his toolkit is stored. Or an unhappy employee that accesses a network share containing business data or intellectual property weeks before his last day and places this information on a USB drive. ShellBags artifacts can help us understand if such actions were performed. So, when you obtain the NTUSER.dat and UsrClass.dat hives you could parse it and then placed events into a timeline.  When corroborated with other artifacts, the incident response team can reconstruct user activities that were performed interactively and understand what happened and when.

Which tools can we use to parse ShellBags?

I like to use RegRipper from Harlan Carvey, ShellBags Explorer from Eric Zimmerman or Sbags from Willi Ballenthin. The below picture shows an example of using Willi’s tool to parse the ShellBags information from the NTUSER.dat and UsrClass.dat hives. As an example, this illustration shows that the attacker accessed several network folders within SYSVOL and also accessed “c:\Windows\Temp” folder.

To give you context, why I’m showing you this particular illustration of accessing the SYSVOL folder, is because they contain Active Directory Group Policy preference files that in some circumstances might contain valid domain credentials that can be easily decrypted. This is a known technique used by attackers to obtain credentials and likely to occur in the beginning of an incident. Searching for passwords in files such as these are simple ways for attackers to get credentials for service or administrative accounts without executing credential harvesting tools.

Next artifact on our list, JumpLists!

Once again, to increase the customer experience and accelerate the workflow, Microsoft introduced on Windows 7 the possibility to allow a user to access a list of recently used applications and files. This is done by enabling the feature to store and display recently opened programs and items in the Start Menu and the taskbar. There are two files that store JumpLists information. One is the {AppId}.automaticDestination-ms and the other is {AppId}.customDestination-ms where {AppId} corresponds to a 16 hex string that uniquely identifies the application and is calculated based on application path CRC64 with a few oddities. These files are stored in the folder “C:\Users\%USERNAME%\AppData\​Roaming\Microsoft\Windows\​Recent\AutomaticDestinations” and “C:\Users\%USERNAME%\AppData\​Roaming\Microsoft\Windows\​Recent\CustomDestinations”. The folder AutomaticDestinations contain files {16hexchars}.automaticDestination-ms and these files are generated by common operating system applications and stored in a in Shell Link Binary File Format known as [MS-SHLLINK] that are encapsulated Inside a Compound File Binary File Format known as MS-CFB or OLE. The folder CustomDestinations contain files {16hexchars}.customDestination-ms and these files are generated by applications installed by the user or scripts there were executed and stored in Shell Link Binary File Format known as [MS-SHLLINK].

Why are JumpLists relevant?

Just like like ShellBags, this artifact allows us to get visibility about the intent or knowledge an attacker had when opening a particular file, launching a particular application or browsing a specific directory during the course of an interactive session. For example, consider an attacker that is operating on a compromised system using Remote Desktop and launches a browser, the JumpList associated with it will contains the most visited or the recently closed website. If the attacker is pivoting between system using the Terminal Services client, the JumpList shows the system that was specified as an argument. If an attacker dumped credentials from memory and saved into a text file and opened it with Notepad, the JumpList will show evidence about it. Essentially, the metadata stored on these JumpList files can be parsed and will show you a chronological list of Most Recently Used (MRU) or Most Frequently Used (MFU) files opened by the user/application. Among other things, the information contains the Standard Information timestamps from the list entry and the time stamps from the file at the time of opening. Furthermore, it shows the original file path and sizes. This information, when placed into a timeline and corroborated with another artifact can give us a clear picture of the actions performed.

Which tools can we use to parse JumpLists?

JumpListsView from NIRSOFT, JumpLister from Mark Waon or JumpLists Explorer from Eric Zimmerman. Below an example of using Eric’s tool to parse the JumpLists files. More specifically the JumpList file that is associated with Notepad. As an example, this illustration shows that an attacker opened the file “C:\Windows\Temp\tmp.txt”with Notepad. It shows when the file was created and the MFT entry. Very useful.

Next artifact, LNK files!

Again, consider an attacker operating on a compromised system using a Remote Desktop session where he dumped the credentials to a text file and then double clicked on the file. This action will result in the creation of the corresponding Windows shortcut file (LNK file). LNK files are Windows Shortcuts. Everyone that has used Windows has created a shortcut of your most favorite folder or program. However, the Windows operating system behind the scenes also keeps track of recently opened files by creating LNK files within the directory “C:\Documents and Settings\%USERNAME%\Recent\”.   The LNK files, like JumpLists, are stored in Shell Link Binary File Format known as [MS-SHLLINK]. When parsed, the LNK file, contains metadata that, among other things, shows the target file Standard Information timestamps, path, size and MFT entry number. This information is maintained even if the target file does no longer exists on the file system. The MFT entry number can be valuable in case the file was recently deleted and you would like to attempt to recover by carving it from the file system.

Which tools can we use to parse .LNK files?

Joachim Metz has an utility that to parse the information from the Windows Shortcut files. The utility is installed by default on SIFT workstation. In the illustration below, while analyzing a disk image, we could see that there are several .LNK files created under a particular profile. Knowing that this profile has been used by an attacker you could parse the files. In this case parsing, when parsing the file “tmp.lnk” file we can see the target file “C:\Windows\Temp\tmp.txt”, its size and when was created.

Next artifact, UserAssist!

The UserAssist registry key keeps track of the applications that were executed by a particular user. The data is encoded using ROT-13 substitution cipher and maintained on the registry key HKEY_USERS\{SID}\Software\​Microsoft\Windows\CurrentVersion​\Explorer\UserAssist.

Why is UserAssist relevant?

Consider an attacker operating on a compromised system where he launched “cmd.exe” to launch other Windows built-in commands, or opened the Active Directory Domains and Trusts Snap-in “domain.msc” to gather information about a particular domain, or launched a credential dumper from an odd directory. This action will be tracked by the UserAssist registry key. The registry key will show information about which programs have been executed by a specific user and how frequently. Due to the nature of how timestamps are maintained on registry ie., only the last modified timestamp is kept, this artifact will show when was the last time that a particular application was launched.

Which tools can we use to parse the UserAssist registry keys?

Once again RegRipper from Harlan Carvey is a great choice. Another tool is UserAssist from Didier Stevens. Other method that I often use is to use log2timeline using Windows Registry plugin and then grepping for the UserAssist parser. In this example, we can see that an attacker while operating under a compromised account, executed “cmd,exe”, “notepad.exe”and “mmc.exe”. Now combining these artifacts with the Shellbags, JumpLists and .LNK files, I can start to interpret the results.

Next artifact, RDP Bitmap Cache!

With the release of RDP 5.0 on Windows 2000, Microsoft introduced a persistent bitmap caching mechanism that augmented the bitmap RAM cache. With this mechanism, when you do a Remote Desktop connection, the bitmaps can get stored on disk and are available for the RDP client, allowing it to load them from disk instead of waiting on the latency of the network connection. Of course this was developed with low bandwidth network connections in mind. On Windows 7 and beyond the cache folder is located on “%USERPROFILE%\AppData\Local\Microsoft\Terminal Server Client\Cache\ ” and there two types of cache files. One that contains a .bmc extension and a newer format that was introduced on Windows 7 that follows the naming convention of “cache{4-digits}.bin’. Both files have tiles of 64×64 pixels. The .bmc files support different bits per pixel ranging from 8-bits to 32-bits. The .bin files are always 32-bits and have more capacity and a file can store up to 100Mb of data.

Why are RDP Bitmap cache files relevant?

If an attacker is pivoting between systems in a particular environment and is leveraging Remote Desktop then, on the system where the connection is initiated you could find the bitmap cache that was stored during the attacker Remote Desktop session. After reconstructing the bitmaps, that translate what was being visualized by the attacker, it might be possible to reconstruct the bitmap puzzle and observe what was seen by the attacker while performing the Remote Desktop connections to the compromised systems. A great exercise for people who like puzzles!

Which tools can we use to parse RDP Bitmap Cache files?

Unfortunately, there aren’t many tools available. ANSSI-FR released a RDP Bitmap Cache parser that you could use to extract the bitmaps from the cache files. There was a tool called BmcViewer that was available on a now defunct website and is great tool to parse the .bmc files. The tool doesn’t support the .bin files. If you know how to code, an interesting project might be to develop a parser that allows you to puzzle the tiles.

Finally, combining these artifacts with our traditional file system metadata timeline and other artifacts such as ShimCache, would allows us to further uncover more details. Below an illustration of parsing ShimCache from a memory image using Volatility and the ShimCacheMem plugin written by Fred House. We could see that there are some interesting files. For example “m64.exe” and looking at the adjacent entries we can see that it shows the execution of “notepad.exe”, “p64.exe” and “reg.exe”. Searching for those binaries on our file system timeline uncovers that for example m64.exe is Mimikatz.

That’s it for today! As I wrote in the beginning, the Windows Even Logs are a treasure trove of information when properly configured but If an attacker attempts to cover his tracks by deleting the Event Logs, there are many other artifacts to look for. Combine the artifacts outlined in this article with File system metadata, ShimCache, AMCache, RecentDocs, Browser History, Prefetch, WorldWheelQuery, ComDlg32, RunMRU, and many others and you likely will end up having a good understanding of what happened and when. Happy hunting!

References:
PS: Due to the extensive list of references I decided to attach a text file with links: references. Without them, this article won’t be possible.

Luttgens, J., Pepe, M., Mandia, K. (2014) Incident Response & Computer Forensics, 3rd Edition
Carvey, H. (2011) Windows Registry Forensics: Advanced Digital Forensic Analysis of the Windows Registry, Second Edition
SANS 508 – Advanced Computer Forensics and Incident Response

Tagged , , , , , , , ,

Analysis of a Master Boot Record – EternalPetya

NoPetya or EternalPetya has kept the security community pretty busy last week. A malware specimen that uses a combined arms approach and maximizes its capabilities by using different techniques to sabotage business operations. One aspect of the malware that raised my interest was the ability to overwrite the Master Boot Record (MBR) and launch a custom bootloader. This article shows my approach to extract the MBR using digital forensic techniques and then analyze the MBR using Bochs. Before we roll up our sleeves let’s do a quick review on how the MBR is used by today’s computers during the boot process.

The computers that rely on BIOS flash memory instead of the new EFI standard, when they boot, the BIOS code is executed and, among other things, the code performs a series of routines that perform hardware checks i.e., Power-On-Self-Tests (POST). Then, the BIOS attempts to find a bootable device. If the bootable device is a hard drive, the BIOS reads the sector 1, track 0, head 0 and if contains a valid MBR (valid means that the sector ends with bytes 0xAA55) it will load that sector into a fixed memory location. By convention the code will be loaded into the real-mode address 0000:7c00. Then, the instruction pointer register is transferred into that memory location and the CPU will start executing the MBR code. What happens next is dependable on the MBR implementation code i.e., different operating systems have different MBR code  Nonetheless, the code needs to fit in the 512-bytes available at disk sector. The MBR follows a standard and its structure contains executable code, the partition table (64-bytes) with the locations of the primary partitions and finally 2-bytes with 0xAA55 signature. This means only 446-bytes are available to implement a MBR. In the Microsoft world, when the MBR code is executed, its role is to find an active partition, read its first sector, which contains the VBR code, load it into memory and transfer execution into it. The VBR is a bootloader program that will find the Windows BootMgr program and executes it All this happens in 16-bits real-mode.

Now, that we have a brief overview about the boot process, how can we extract and analyze the MBR? More specifically the MBR that is used by EternalPetya? Well, we infect a victim machine on a controlled and isolated environment. We know that EternalPetya main component is a DLL and we can launch it and infect a Windows machine by running “rundll32.exe petya.dll, #1 10”. Our setup consisted of 2 Virtual Machines. One running with Windows 7 and another running REMnux. We created a snapshot of the victim machine before the infection. Then executed the malware. Following that, we waited 10 minutes for the infection to complete. The scheduled task created by the malware restarted the operating system and a ransom note appeared. Then, I shutdown the Windows 7 virtual machine and used vmware-vdiskmanager.exe utility to create a single VMDK file from the disk state before and after the infection. Next, I moved the VMDK files to a Linux machine where I used QEMU to convert the VMDK images to RAW format.

Following that I could start the analysis and look at the MBR differences. The picture below illustrates the difference between the original MBR and the EternalPetya MBR. On the right side you have the EternalPetya MBR, the first 147 bytes (0x00 through 0x92) contain executable code.  The last 66 bytes (0x1be through 0x1fd) contain the partition table and are equal to the original MBR.

So, we are interested in the code execution instructions. We can start by extracting the MBR into a binary file and convert it to assembly instructions. This can be done using radare, objdump or ndisasm. Now, this is the hard part of the analysis. Read the assembly instructions and understand what it does. We can look at the instructions and perform static analysis but we can also perform dynamic analysis by running the MBR code, combining both worlds we will have better understanding – or at least we can try.

To perform dynamic analysis of the MBR code we will use Bochs. Bochs is an open source, fully fledged x86 emulator. Originally written by Kevin Lawton in 1994 is still being actively maintained today and last April version 2.6.9 was released. Bochs brings a CLI and GUI debugger and is very useful to debug our MBR code.  In addition, Bochs can be integrated with IDA PRO and Radare.  You can download Bochs from here.  In our case, we want to use Bochs to dynamically debug our MBR code. For that we need a configuration file called Bochsrc which is used to specify different options such as the disk image and also the CHS parameters for the disk. This article from Hex-Rays contains a how-to on how to integrate Bochs with IDA PRO. At the end of the article there is the mbr_Bochs.zip file that you can download. We will use these files to use Bochs standalone or combined with IDA PRO in case you have it. The Bochsrc file that comes with the ZIP file contains options that are deprecated on the newer Bochs version. The picture below shows the Bochsrc options I used. The Bochs user guide documents this file well.

Then you can try your configuration setup and launch Bochs. If you have IDA PRO then you can use this guide starting from step 6 in order to integrate it with IDA PRO. If all is set up, the debugging session will open and stop at the first instruction from its own BIOS code at memory address F000:FFF0.  Why this address? You can read this and many other low level things in the outstanding work from Daniel B. Sedory.

Uncomment the last line from the Bochsrc configuration file, to tell Bochs to use the Enhanced Debugger. For further references, you can read the “How to DEBUG System Code using The Bochs Emulator on a Windows™ PC” article. Start Bochs again and the GUI will show up. You can load the stack view by pressing F2. Then set a breakpoint where the MBR code will be loaded by issuing the command “lb 0x7c00” and then the “c” to continue the debugging session.

Now we can look at the code, step into the instructions, inspect the registers and stack. After some back and forth with the debugger I created the following listing with my interpretation of some of the instructions.

Bottom line, the MBR code will perform a loop that uses BIOS interrupt 0x13 function 0x42 to read data starting at sector 1 of the hard-drive. The loop copies 8880 (0x22af) bytes of data into memory location 0x8000. When the copy is done, the execution is transferred to the address 0x8000 by performing a far jump and the malicious bootloader is executed. The malicious bootloader code has been uploaded by Matthieu Suiche to Virus Total here. You can also extract it from the hard drive by extracting the sector 1 through 18 or better using the commands from the following picture. Then you can perform static and dynamic analysis.

The 16-bits bootloader code is harder to analyze than the MBR code but it is based on the Petya ransomware code from 2016. In this great article, from Hasherezade, she analyzes both Petya and EternalPetya bootloader using IDA PRO. When you use Bochs integrated with IDA PRO disassembler and debugger, the analysis is more accessible due to the powerful combination.

That’s it for today – Entering the world of real-mode execution on x86 is quite interesting. Analyzing code that relies on BIOS services such as software interrupts to perform different operations like reading from disk or writing to screen or, accessing the memory through segments is revealing. What we learned today might be a starting point to start looking at bootkits that are beneath the operating system and subvert the MBR boot sequence.

Have fun!

References:

Windows Internals, Sixth Edition, Part 2 By: Mark E. Russinovich, David A. Solomon, and Alex Ionescu

Various articles written by Daniel B. Sedory : http://starman.vertcomp.com/index.html

http://standa-note.blogspot.ch/2014/11/debugging-early-boot-stages-of-windows.html

Tagged , , ,

Threat Hunting in the Enterprise with AppCompatProcessor

Last April, at the SANS Threat Hunting and IR Summit, among other things, there was a new tool and technique released by Matias Bevilacqua. Matias’s presentation was titled “ShimCache and AmCache enterprise-wide hunting, evolving beyond grep” and he released the tool AppCompatProcessor. Matias also wrote a blog post “Evolving Analytics for Execution Trace Data” with more details.

In this article, I want to go over a quick exercise on how to use this tool and expand the existing signatures. First, let me write that, in case you have a security incident and you are doing enterprise incident response or you are performing threat hunting as part of your security operations duties, this is a fantastic tool that you should become familiar with and have on your toolkit. Why? Because it allows the security teams to digest, parse and analyze, at scale, two forensic artifacts that are very useful. The forensic artifacts are part of the Windows Application Experience and Compatibility features and are known as ShimCache and the AMCache.

To give you more context, the ShimCache can be obtained from the registry and from it we can obtain information about all executable binaries that have been executed in the system since it was rebooted. Furthermore, it tracks its size and the last modified date. In addition, the ShimCache tracks executables that have not been executed but were browsed for example through explorer.exe. This makes a valuable source of evidence for example to track executables that were on the system but weren’t executed – consider an attacker that used a directory on a system to move around his toolkit. The AMCache is stored on a file and from it we can retrieve information for every executable that run on the system such as the PATH, last modification time and created, SHA1 and PE properties. You can read more about those 2 artifacts in the article I wrote last year.

So, I won’t go over on how to acquire this data at scale – feel free to share you technique in the comments – but, AppCompatProcessor digests data that has been acquired by ShimCacheParser.py, Redline and MIR but also consumes raw ShimCache and AMCache registry hives. I will go directly to the features.At the time of this writing the tool version is 0.8 and one of the features I would like to focus today is the search module. This module allows us to search for known bad using regex expressions. The search module was coded with performance in mind, which means the regex searches are quite fast. By default, the tool includes more than 70 regex signatures for all kinds of interesting things an analyst will look for when perform threat hunting. Signatures include searching for dual usage tools like psexec , looking for binaries in places where they shouldn’t normally be, commonly named credential dumpers, etc. The great thing is that you can easily include your own signatures. Just add a regex line with your signature!

For this exercise, I want to use the search module to search for binaries that are commonly used by the PlugX backdoor family and friends. This backdoor is commonly used by different threat groups on targeted attacks. PlugX is also refered as KORPLUG, SOGU, DestroyRAT and is a modular backdoor that is designed to rely on the execution of signed and legitimated executables to load malicious code. PlugX, normally has three main components, a DLL, an encrypted binary file and a legitimated executable that is used to load the malware using a technique known as DLL search order. I won’t go discuss the details about PlugX in this article but you can read the White Paper “PlugX – Payload Extraction” done by Kevin O’Reilly from Context, the presentation about Plugx at Black Hat ASIA in 2014 given by Takahiro Haruyama and Hiroshi Suzuki, the analysis done by the Computer Incident Response Center Luxembourg and the Ahnlab threat report. With this and other reports you could start compiling information about different PlugX payloads. However, Adam Blaszczyk from Hexacorn, already did that job and wrote an article where he outlines different PlugX payloads seen in the wild.

Ok, with this information, we start creating the PlugX regex signatures. Essentially we will be looking for the signed and legitimate executables but in places where they won’t normaly be. The syntax to create a new regex signature is simple and you can add your own signatures to the existing AppCompatSearch.txt file or just create a new file called AppCompatSearch-PlugX.txt which will be consumed automatically by the tool. The figure below shows the different signatures that I produced. . At the time of this writing, this is still work in progress but is a starting point.

Next step, launch AppCompatProcessor against our data set using the newly created signatures. The following picture shows how the output of the search module looks like. In this particular case the search produced 25 hits and a nicely presented summary of the hits is displayed on a histogram. The raw dumps of the hits are saved on the file called Output.txt.  As an analyst or investigator, you would look at the results and verify which ones would be worth to further investigate and which ones are false positives. For this exercise, there was a hit that triggered on the file “c:\Temp\MsMpEng.exe”. This file is part of the Windows Defender suite but could be used by PlugX as part of DLL search order hijack technique. Basically, the attacker will craft a malicious DLL named MpSvc.dll and will place that in the same directory as the MsMpEng.exe file and execute MsMpEng.exe. The DLL would need to be crafted in a special way but that is what PlugX specializes in. This will load the attacker code.

Following these findings, we would want to look at the system that triggered the signature and view all the entries. The picture below shows this step where we use the dump module. The output shows all the ShimCache entries for this particular system. The entries are normally sorted in order of execution from bottom to top, and in this case, adjacent to the “c:\Temp\MsMpEng.exe” file there are several windows built-in commands that were executed and a file named “c:\Temp\m64.exe”. This is what Matias calls a strong temporal execution correlation. This is indicative that an attacker obtained access to the system, executed several windows built-in commands and and executed a file called “m64.exe” which likely is Mimikatz or a cousin. 

Following those leads, you might want to obtain those binaries from the system and perform malware analysis in order to extract indicators of compromise such as the C&C address, look at other artifacts such Windows Event Logs, UsnJournal, memory, etc.. and have additional leads. In addition, you might want to further use AppCompatProcessor to search for the “m64.exe” file and also use the tstack module, to search across all the data set for binaries that match the date of those two binaries. With these findings, among other things, you would need to scope the incident by understanding which systems the attacker accessed, find new investigation leads and pivot on the findings. AppCompatProcessor is a tool that helps doing that. This kind of finding would definitely trigger your incident response processes and procedures.

That’s it, hopefully, AppCompatProcessor will reduce the entry barrier for your security operations center or incident response teams to start performing threat hunting in your environment and produce actionable results. If you find this useful, contribute with your threat hunting signatures in AppCompatProcessor GitHub repo and Happy Hunting!


Tagged , , , , , ,

Intro to Linux Forensics

This article is a quick exercise and a small introduction to the world of Linux forensics.  Below, I perform a series of steps in order to analyze a disk that was obtained from a compromised system that was running a Red Hat operating system. I start by recognizing the file system, mounting the different partitions, creating a super timeline and a file system timeline. I also take a quick look at the artifacts and then unmount the different partitions. The process of how to obtain the disk will be skipped but here are some old but good notes on how to obtain a disk image from a VMware ESX host.

When obtaining the different disk files from the ESX host, you will need the VMDK files. Then you move them to your Lab which could be simple as your laptop running a VM with SIFT workstation. To analyze the VMDK files you could use the “libvmdk-utils” package that contain tools to access data store in VMDK files. However, another approach would be to convert the VMDK file format into RAW format. In this way, it will be easier to run the different tools such as the tools from The Sleuth Kit – which will be heavily used – against the image. To perform the conversion, you could use the QEMU disk image utility. The picture below shows this step.

Following that, you could list the partition table from the disk image and obtain information about where each partition starts (sectors) using the “mmls” utility. Then, use the starting sector and query the details associated with the file system using the “fsstat” utility. As you could see in the image, the “mmls” and “fsstat” utilities are able to identify the first partition “/boot” which is of type 0x83 (ext4). However, “fsstat” does not recognize the second partition that starts on sector 1050624.

This is due to the fact that this partition is of type 0x8e (Logical Volume Manager). Nowadays, many Linux distributions use LVM (Logical Volume Manager) scheme as default. The LVM uses an abstraction layer that allows a hard drive or a set of hard drives to be allocated to a physical volume. The physical volumes are combined into logical volume groups which by its turn can be divided into logical volumes which have mount points and have a file system type like ext4.

With the “dd” utility you could easily see that you are in the presence of LVM2 volumes. To make them usable for our different forensic tools we will need to create device maps from the LVM partition table. To perform this operation, we start with “kpartx” which will automate the creation of the partition devices by creating loopback devices and mapping them. Then, we use the different utilities that manage LVM volumes such as “pvs”, “vgscan” abd “vgchange”. The figure below illustrates the necessary steps to perform this operation.

After activating the LVM volume group, we have six devices that map to six mount points that make the file system structure for this disk. Next step, mount the different volumes as read-only as we would mount a normal device for forensic analysis. For this is important to create a folder structure that will match the partition scheme.

After mounting the disk, you normally start your forensics analysis and investigation by creating a timeline. This is a crucial step and very useful because it includes information about files that were modified, accessed, changed and created in a human readable format, known as MAC time evidence (Modified, Accessed, Changed). This activity helps finding the particular time an event took place and in which order.

Before we create our timeline, noteworthy, that on Linux file systems like ext2 and ext3 there is no timestamp about the creation/birth time of a file. There are only 3 timestamps. The creation timestamp was introduced on ext4. The book “The Forensic Discovery 1st Edition”from Dan Farmer and Wietse Venema outlines the different timestamps:

  • Last Modification time. For directories, the last time an entry was added, renamed or removed. For other file types, the last time the file was written to.
  • Last Access (read) time. For directories, the last time it was searched. For other file types, the last time the file was read.
  • Last status Change. Examples of status change are: change of owner, change of access permission, change of hard link count, or an explicit change of any of the MACtimes.
  • Deletion time. Ext2fs and Ext3fs record the time a file was deleted in the dtime stamp.the filesystem layer but not all tools support it.
  • Creation time: Ext4fs records the time the file was created in crtime stamp but not all tools support it.

The different timestamps are stored in the metadata contained in the inodes. Inodes are the equivalent of MFT entry number on a Windows world. One way to read the file metadata on a Linux system is to first get the inode number using, for example, the command “ls -i file” and then you use “istat” against the partition device and specify the inode number. This will show you the different metadata attributes which include the time stamps, the file size, owners group and user id, permissions and the blocks that contains the actual data.

Ok, so, let’s start by creating a super timeline. We will use Plaso to create it. For contextualization  Plaso is a Python-based rewrite of the Perl-based log2timeline initially created by Kristinn Gudjonsson and enhanced by others. The creation of a super timeline is an easy process and it applies to different operating systems. However, the interpretation is hard. The last version of Plaso engine is able to parse the EXT version 4 and also parse different type of artifacts such as syslog messages, audit, utmp and others. To create the Super timeline we will launch log2timeline against the mounted disk folder and use the Linux parsers. This process will take some time and when its finished you will have a timeline with the different artifacts in plaso database format. Then you can convert them to CSV format using “psort.py” utility. The figure below outlines the steps necessary to perform this operation.

Before you start looking at the super timeline which combines different artifacts, you can also create a traditional timeline for the ext file system layer containing data about allocated and deleted files and unallocated inodes. This is done is two steps. First you generate a body file using “fls” tool from TSK. Then you use “mactime” to sort its contents and present the results in human readable format. You can perform this operation against each one of the device maps that were created with “kpartx”. For sake of brevity the image below only shows this step for the “/” partition. You will need to do it for each one of the other mapped devices.

Before we start the analysis, is important to mention that on Linux systems there is a wide range of files and logs that would be relevant for an investigation. The amount of data available to collect and investigate might vary depending on the configured settings and also on the function/role performed by the system. Also, the different flavors of Linux operating systems follow a filesystem structure that arranges the different files and directories in a common standard. This is known as the Filesystem Hierarchy Standart (FHS) and is maintained here. Its beneficial to be familiar with this structure in order to spot anomalies. There would be too much things to cover in terms of things to look but one thing you might want to run is the “chkrootkit” tool against the mounted disk. Chrootkit is a collection of scripts created by Nelson Murilo  and Klaus Steding-Jessen that allow you to check the disk for presence of any known  kernel-mode and user-mode rootkits. The last version is 0.52 and contains an extensive list of known bad files.

Now, with the supertimeline and timeline produced we can start the analysis. In this case, we go directly to timeline analysis and we have a hint that something might have happened in the first days of April.

During the analysis, it helps to be meticulous, patience and it facilitates if you have comprehensive file systems and operating system artifacts knowledge. One thing that helps the analysis of a (super)timeline is to have some kind of lead about when the event did happen. In this case, we got a hint that something might have happened in the beginning of April. With this information, we start to reduce the time frame of the (super)timeline and narrowing it down. Essentially, we will be looking for artifacts of interest that have a temporal proximity with the date.  The goal is to be able to recreate what happen based on the different artifacts.

After back and forth with the timelines, we found some suspicious activity. The figure below illustrates the timeline output that was produced using “fls” and “mactime”. Someone deleted a folder named “/tmp/k” and renamed common binaries such as “ping” and “ls” and files with the same name were placed in the “/usr/bin” folder.

This needs to be looked further. Looking at the timeline we can see that the output of “fls” shows that the entry has been deleted. Because the inode wasn’t reallocated we can try to see if a backup of the file still resides in the journaling. The journaling concept was introduced on ext3 file system. On ext4, by default, journaling is enabled and uses the mode “data=ordered”. You can see the different modes here. In this case, we could also check the options used to mount the file system. To do this just look at “/etc/fstab”. In this case we could see that the defaults were used. This means we might have a chance of recovering data from deleted files in case the gap between the time when the directory was deleted and the image was obtained is short. File system journaling is a complex topic but well explained in books like “File system forensics” from Brian Carrier. This SANS GCFA paper from Gregorio Narváez also covers it well.  One way you could  attempt to recover deleted data is using the tool “extundelete”.  The image below shows this step.

The recovered files would be very useful to understand more about what happened and further help the investigation. We can compute the files MD5’s, verify its contents and if they are known to the NSLR database or Virustotal. If it’s a binary we can do strings against the binary and deduce functionality with tools like “objdump” and “readelf”. Moving on, we also obtain and look at the different files that were created on “/usr/sbin” as seen in the timeline. Checking its MD5, we found that they are legitimate operating system files distributed with Red Hat. However, the files in “/bin” folder such as “ping” and “ls” are not, and they match the MD5 of the files recovered from “/tmp/k”.  Because some of the files are ELF binaries, we copy them to an isolated system in order to perform quick analysis. The topic of Linux ELF binary analysis would be for other time but we can easily launch the binary using “ltrace -i” and “strace -i” which will intercept and record the different function/system calls. Looking at the output we can easily spot that something is wrong. This binary doesn’t look the normal “ping” command, It calls the fopen() function to read the file “/usr/include/a.h” and writes to a file in /tmp folder where the name is generated with tmpnam(). Finally, it generates a segmentation fault. The figure below shows this behavior.

Provided with this information, we go back and see that this file “/usr/include/a.h” was modified moments before the file “ping” was moved/deleted. So, we can check when this “a.h” file was created – new timestamp of ext4 file system – using the “stat” command. By default, the “stat” doesn’t show the crtime timestamp but you can use it in conjunction with “debugfs” to get it. We also checked that the contents of this strange file are gibberish.

So, now we know that someone created this “a.h” file on April 8, 2017 at 16:34 and we were able to recover several other files that were deleted. In addition we found that some system binaries seem to be misplaced and at least the “ping” command expects to read from something from this “a.h” file. With this information we go back and look at the super timeline in order to find other events that might have happened around this time.  As I did mention, super timeline is able to parse different artifacts from Linux operating system. In this case, after some cleanup we could see that we have artifacts from audit.log and WTMP at the time of interest. The Linux audit.log tracks security-relevant information on Red Hat systems. Based on pre-configured rules, Audit daemon generates log entries to record as much information about the events that are happening on your system as possible. The WTMP records information about the logins and logouts to the system.

The logs shows that someone logged into the system from the IP 213.30.114.42 (fake IP) using root credentials moments before the file “a.h” was created and the “ping” and “ls” binaries misplaced.

And now we have a network indicator. Next step we would be to start looking at our proxy and firewall logs for traces about that IP address. In parallel, we could continue our timeline analysis to find additional artifacts of interest and also perform in-depth binary analysis of the files found, create IOC’s and, for example, Yara signatures which will help find more compromised systems in the environment.

That’s it for today. After you finish the analysis and forensic work you can umount the partitions, deactivate the volume group and delete the device mappers. The below picture shows this steps.

Linux forensics is a different and fascinating world compared with Microsoft Windows forensics. The interesting part (investigation) is to get familiar with Linux system artifacts. Install a pristine Linux system, obtain the disk and look at the different artifacts. Then compromise the machine using some tool/exploit and obtain the disk and analyze it again. This allows you to get practice. Practice these kind of skills, share your experiences, get feedback, repeat the practice, and improve until you are satisfied with your performance. If you want to look further into this topic, you can read “The Law Enforcement and Forensic Examiner’s Introduction to Linux” written by Barry J. Grundy. This is not being updated anymore but is a good overview. In addition, Hal Pomeranz has several presentations here and a series of articles written in the SANS blog, specially the 5 articles written about EXT4.


References:
Carrier, Brian (2005) File System Forensic Analysis
Nikkel, Bruce (2016) Practical Forensic Imaging

Tagged , , , ,

Offensive Tools and Techniques

In this article I go over a series of examples that illustrate different tools and techniques that are often used by both sides of the force! To exemplify it, I will follow the different attack stages and will use the intrusion kill chain as methodology. This methodology consist of seven stages. Reconnaissance, weaponization, delivery, exploitation, installation, C2 and action on objectives.

offensive-logoLet’s start with Recon! The goal here is to seek information about the target, normally a person. Targeting high profile individuals might be difficult because these individuals tend to have a personalized security group that looks after them. However, using different intelligence-gathering techniques such as searching information available in a variety of public information sources you can target other personnel. Due to the human nature, people succumb to social engineering techniques and several times they provide more information than is necessary. A starting point is to harvest metadata about the organization and personnel. Normally, companies do not know what metadata they are giving way. Metadata is a golden pot of information and information such as usernames, software versions, printers, email addresses and others can be retrieved using a tool such as FOCA Metadata Analysis Tool. You can see the presentation that was given by Chema Alonso and Jose Palazon Palatko in 2010 at Defcon 18 about FOCA 2.5.  At the end the attacker will use whatever works to gather as much information as possible about employee names, position in the hierarchy, friends and relatives, hobbies, etc.

Next step, weaponization and delivery! After getting as much information as possible and performing enough recon the attacker will choose the best method to perform the attack with his available resources. Nowadays, spear phishing techniques with attached documents are very dominant and probably a good choice as attack vector. The sophistication of how a document is weaponized and delivered might correlate with the amount of resources available to the attacker. In the example below I show how you could use Metasploit to easily create a word document with a malicious macro that when executed will connect back to the attacker system and establish a command and control channel. The payload uses HTTPS as communication channel but it uses a self-signed certificate and points to an IP address and not a domain. In organization of different sizes, many times the web filtering controls are tight and use different blocking techniques that might detect and stop this type of connection. However, the attacker can register a new domain or buy an expired domain ahead of time, create a simple and realistic web page and categorize the domain in a category such as Finance or Healthcare – these are normally allowed in web filtering products and probably the SSL wouldn’t be terminated and inspected. In addition, the attacker can buy a cheap SSL certificate and make this scenario much more realistic.  In addition, Metasploit just introduced an updated traffic obfuscation technique that will make harder for security products to detect it.

Before I continue with the different tools and techniques, is worth to mention that in this article I give several examples using the Metasploit Framework. For those of you who don’t know, Metasploit framework was originally created by the legendary H.D. Moore back in 2003. Originally coded in Perl and then ported to Ruby. In 2004, Metasploit Framework 2.0 was released and had less than 20 exploits and a similar number of payloads. Today, the free version of Metasploit framework has more than 1600 exploits and more than 400 payloads. In addition many other auxiliary modules, encoders and post exploitation modules are available. The modular framework of Metasploit makes it a fantastic tool to design, build and launch exploits.

So, the picture below illustrates how to use Metasploit to create a weaponized Word document. An alternative to this technique is to use PowerShell Empire. See this article from Matt Nelson.

offensive-macro

Then, the word document can be customized and tailored to the target. To summarize, the attacker crafts a phishing email, either with a weaponized document or malicious link. This coupled with different social engineering techniques that appeal to human nature and exploit human vulnerabilities have good probability to make the attack a success. There is other factor that might impact the success of the campaign, which is the ability of the malicious email/link to circumvent the multitude of expensive filters that are layered throughout the network boundary and reach to the endpoint. If the email reaches the endpoint, you might have a well-intentioned employee making mistakes.  If these conditions are met, the attacker will establish a foothold inside the corporate network.

The picture below depicts the steps performed by the attacker to launch the Metasploit handler that will accept the beacon from the malicious document. Then, it shows the communication received and the established session.

offensive-macrohandler

Next step exploitation! With a foothold in the environment and an established communication channel the attacker will act quickly, stealthy and will probably try to find avenues to exploit other systems and achieve higher privileges.  Ruben Boonen who maintains fuzzysecurity.com and goes by the handler @FuzzySec has wrote a very comprehensive article where he describes the different techniques that could be used to escalate privileges on a Windows environment. Another great resource is the paper “Windows Services – All roads lead to SYSTEM” from Kostas Lintovois that exemplifies several ways in which misconfigured services could be compromised.  These techniques are very useful for attackers because in many organizations normal users don’t have admin rights. Admin rights are likely a goal that all attackers aim in an enterprise environment because it facilitates their job.

Many of the techniques written by Ruben and others have been materialized in the post-exploitation framework known as PowerSploit in a module called PowerUp.ps1 which has been originally written by Will Schroeder – a brilliant security researcher that in recent years released powerful tools -. PowerSploit contains a great library of modules and scripts that help in all phases of an attack life-cycle.  The PowerUp module facilitates the discovery of conditions that would allow an attacker to execute a technique that will lead him to get a privileged account. All this done using PowerShell and can be executed from within Meterpreter using the PowerShell extension that was written by OJ Reeves and incorporated into Metasploit  This means, that attacker can run PowerUp from within Metasploit. You can read more about PowerUp on Will Schroeder blog and also get PowerUp cheat sheet from here.

The picture below illustrates this scenario, where the attacker after getting a foothold in the environment – via phishing email – verifies that the account he is operating with doesn’t have enough privileges to run additional modules such as the powerful Mimikatz. Mimikatz is a post-exploitation tool written in C and developed by Benjamin Delphy. You can read more about many of its features on Sean Metcalf Unofficial Guide to Mimikatz and Command reference here and here. However, Meterpreter contains a PowerShell module that would allow the attacker to execute PowerShell commands. In this case the attacker can load the PowerShell module, execute the necessary commands to download the PowerUp from GitHub, a site owned by the attacker or other place and then perform the Invoke-AllChecks. At the time of this writing, the PowerUp module contains 14 checks.

offensive-powerup

In this case, as you could see in the image, the conditions necessary to perform DLL hijacking are found by PowerUp module. Essentially, the system contains a directory that any authenticated user can write to and this directory is part of the %PATH% environment variable. With this the attacker can leverage the DLL search order and obtain system privileges.  In this case PowerUp suggests to use “wlbsctrl.dll”. For this to work the Windows service “IKE and AuthIP IPsec Keying Modules” needs to be running but in enterprises where workstations have VPN clients installed this is quite common. This vulnerability was discovered in 2012 by the High-Tech Bridge Security Research Lab. It leverages the Windows service “IKE and AuthIP IPsec Keying Modules”, which during startup tries to load the “wlbsctrl.dll” DLL that doesn’t exist on default Windows installations. A great explanation about how this technique works and why the vulnerability exists was written by Parvez Anwar here.  Another resource about this topic is “DLL Hijacking Like a Boss!” presentation Jake Williams and an old article from the Corelan team here.

So, now that there is an avenue to explore, the next step is for the attacker to create a DLL that matches the architecture of the target system and has the name “wlbsctrl.dll”. This can be easily done with msfvenom. This utility is very popular to create one liners commands that will generate and encode a desired payload. Msfvenom was added to Metasploit in 2011 and combines the older Msfpayload and Msfencode commands in one utility. This is showing in the figure below.

offensive-dll

Another way to leverage this technique is to use Write-HijackDll function available in the PowerUp.ps1 module. This function will create and drop the “wlbsctrl.dll” DLL into the writable path and when the service starts the DLL will load and will add a user to local administrators with a predefined password.

An important remark in regards to the usage of PowerShell is that on some environments the security might be tight and PowerShell execution might be blocked. However, in this cases the attacker could use other techniques and use other tools such as PowerOPS: PowerShell for Offensive Operations tool written by Portuculis Lab and inspired in the PowerShell Runspace Post Exploitation Toolkit written by Cn33liz.

After that, the attacker uploads the DLL to the desired folder, the attacker can force a reboot or wait for the system to be rebooted. When the system starts, the IKEEXT service will be started and the malicious DLL will be loaded, spawning a command and control channel back to the system owned by the attacker and with SYSTEM privileges. The picture below illustrates the upload of the malicious DLL to the folder that has weak permissions and is part of the %PATH% variable. Then it follows the command and control channel that is established due to the IKEEXT service being started. Due to the high privileges the attacker can then move on and start using the powerful Mimikatz module. To start he can obtain clear text credentials by using Kerberos command.

offensive-dllhijack

Now, the attacker is operating under a high privileged account! With that, the attacker can move on and find a way to establish a persistence mechanism and in parallel move laterally within the environment.

Next step, installation and C2! There are a multitude of clever techniques and tools used by attackers to accomplish a persistence mechanism but in this case I would give an example of using WMI combined with PowerShell using a payload crafted by Metasploit.

WMI has gained popularity among attacker in recent years. A good resource is the presentation that Matt Graeber gave on BlackHat 15 : Abusing Windows Management Instrumentation (WMI) to Build a Persistent, Asynchronous, and Fileless Backdoor. In addition, William Ballenthin, Matt Graeber and Claudiu Teodorescu have written a great paper about the usage of WMI for both offense and defense. Furthermore, you can read the paper WMI for Detection and Response from NCCIC/ICS-CERT.

So, to achieve persistence the attacker could use Windows Management Instrumentation (WMI). The WMI will be used as a vehicle to trigger a payload to run at a particular event. This event could be a specific schedule, an event that occurred at the OS level, such as login or one of the many events supported by WMI. The payload would leverage PowerShell to perform a technique known as Reflective DLL injection which will call back to the attacker system and inject the Metasploit Meterpreter – to read more about Reflective DLL injection read this article from Dan Staples and its references -. The communication occurs over HTTPS back to the domain owned by the attacker. In sum, the attacker will only use windows built-in functionality combined with Metasploit. This arrangement of different tools and techniques lead to more powerful attacks that are harder to detect. In addition this technique leverages in memory payload that doesn’t touch disk due to the fact that uses a PE loader in memory to load the DLL and not the traditional LoadLibraryA() method. The persistence mechanism is inside the WMI repository which is likely to be outside of the radar of many defenders.

Let’s see how the attacker can build this. To craft the payload the attacker could use msfvenom utility that is part of Metasploit framework. The following picture illustrates the use of msfvenom to create the Reflective DLL injection payload using PowerShell format.

offensive-pshcmd

Next step would be to weaponize this payload into a Managed Object Format (MOF) script.

offensive-wmimof

Next the attacker will use the Managed Object Format (MOF) compiler, Mofcomp.exe on the target machine. This utility will parse a file containing MOF statements and adds the classes and class instances defined in the file to the WMI repository. A good article about MOF is “Playing with MOF files on Windows, for fun & profit” from Jérémy Brun-Nouvion. After that, a series of wmic.exe commands can be executed to view the contents of the different classes.

offensive-wmicommands

These commands are executed within the Meterpreter session that was established with the DLL hijacking technique. Then the attacker can cover his tracks and delete the malicious MOF script and move on. When the WMI event is triggered, the payload is invoked and a meterpreter session is established back to the system owned by the attacker. With this, the attacker has a persistence mechanism and is operating in the target environment with a privileged account.

Next, action on objectives! Lateral movement has been traditionally done using a variety of commands and tools such as net.exe, psexec.exe and wmic.exe. Nowadays, you can add PowerShell to the mix.. More specifically using the PowerView tool which was developed by William Schroeder and is part of PowerSploit tools and scripts. PowerView is an advanced active directory enumeration tool written in PowerShell that allows an attacker to gather extensive amount of information about a Windows enterprise environment. You can read more about the reason behind Powerview hereThis great write-up demonstrates several use cases for PowerView. Once again, we can load PowerView from within our Meterpreter sessions. In this case, the session has SYSTEM privileges and was obtained leveraging the WMI persistence but PowerView can run with a normal account.  The picture below exemplifies this step.

offensive-powerview

The list of functions available within PowerView is here and the cheat sheet here. The attacker starts enumerating different aspects of the Active Directory and the different systems just by leveraging PowerShell commands. To perform this he can leverage different techniques and modules within PowerView.  For a great summary you can see – once again – William Schroeder presentation given at Troopers 16 entitled “I have the power view”.

So, to start, the attacker can leverage the Kerberoasting technique. This technique pioneered by Tim Medin – I recommend you watch his presentation “Attacking Kerberos – Kicking the Guard God of Hades” – is brilliant and exploits the way Kerberos functions inside a Microsoft environment. This technique has been reorganized and adopted by PowerView and to run it is as simple as to list all user accounts in the active directory environment that have a SPN, request a Kerberos ticket and extract the crypto material. Then crack it offline to obtain clear text password. You can read more about it in this two articles written by William here and here. The below picture illustrates the Kerberoasting technique.

offensive-kerberoast

After obtaining the hash you could use John the Ripper to crack the password using as hash format the krb5tgs.

Another attack vector is to find accounts in the Active Directory that don’t require Kerberos preauthentication i.e., the PreAuthNotRequire attribute is enabled. This technique was pioneered by Geoff Janjua from Exumbra Operations and you can read the work he did in the article “Kerberos Party Tricks: Weaponizing Kerberos Protocol Flaws“. Essentially the technique consists on listing all accounts that have this attribute and request a Kerberos ticket for those accounts. This ticket contains crypto material that can be extracted and cracked offline. Once again this technique was adopted by PowerView and you can read more about it here.

Finally, if these techniques don’t work, then the attacker likely will move from system to system until he finds a system where he can obtain administrative privileges and move on until he finds a domain admin. This can be daunting task in large environments but once again William Schroeder coded the necessary steps into a series of PowerView modules that are coined with the Hunter word such as Invoke-UserHunter, Invoke-StealthUserHunter and many others that will facilitate the search for high value targets. You can view his presentation “I hunt sysadmins” to understand more what these modules do behind the scenes.  Justin Warner, one of the founders of PowerShell Empire, wrote a great article explaining how these modules works and went further by explaining a technique he named as derivative local admin. This technique was then automated by Andy Robbins which started in a proof-of-concept tool called PowerPath which leverages algorithms that are used to find the shortest path between two points. Andy then worked with Rohan Vazarkar and Will Schroeder  and their work culminated in the release of a tool called BloodHound. The tool was released as open source tool at DEF CON 24. Bottom line, using the different techniques and tools implemented by these brilliant folks the threat actor is likely to succeed obtaining a high privileged account.

Then, is matter of pivoting inside the enterprise environment using the obtained privileged accounts. For that the attacker can leverage the netsh.exe port forwarding feature or the Meterpreter port proxy command to pivot between internal systems. This technique is commonly used by attackers that want to use an internal system as pivot, allowing direct access to machines otherwise inaccessible from the attacking system. The command in the picture below illustrates this, where after configuring the port forwarding on the compromised system, the attacker can use wmic.exe to launch PowerShell on a remote system that will connect back to the attacker system and establish a meterpreter session.

offensive-wmimove

From this moment, its a cycle. Enumerate weakness, exploit them, compromise the system, move further, repeat. This cycle goes on and on until the attacker meets his objectives. A great resource about the techniques that were shown and many others are listed in this article written by Raphael Mudge, the author of Cobalt Strike.

That’s it. With this we covered different tools and techniques that are used in the different attack stages and used nowadays by security professionals but as well by cyber criminals and APT groups. After this, I would ask, how would you detect, prevent and respond to each one of the steps outlined in this attack scenario?

Feel free to share your ideas in the comments below. Thanks for reading!

Tagged , , , , , , , , ,